 Talking about Nielsen in radio circles is a lot like talking about Donald Trump – with anyone. There’s no shortage of opinions, but emotions almost always run very high.
There’s a lot on the line, and Nielsen ratings are still the currency of the radio broadcasting industry. Whether you’re measured by diaries or meters, the ratings are often the center of both tactical and strategic conversations – how to move them, how to read them, what they mean, and what they say about a station’s programming or sales effort.
But besides the weekly/monthly/quarterly ratings that often thrill, disgust, or rile their thousands of clients all over the U.S., Nielsen publishes a lot of valuable data that can be especially helpful once you’re done counting cume, occasions, or TSL. It’s just that many programmers don’t have the time to actually read Nielsen’s missives or consider their implications.
Because unlike perceptual research companies or consultants, Nielsen shies away from interpreting, much less recommending, leaving the data up to interpretation. As it should be. And that leaves it up to the rest of us to make sense of their numbers and their trend lines.
This week, one of those robust missives – “Radio On The Road” – showed up in my email box – and it’s loaded with data that will delight and frustrate. And it sure is stimulating.
I like to think of myself as something of a “Data Whisperer.” And I stared at some of this info from Nielsen and started connecting the dots.
The good
One of the key findings from the report is that the vast majority of radio listeners are employed full-time. In fact, more than three-fourths are 18-64 years-old and in the workplace. And these consumers listen to radio 2.5 hours more per week than those who are retired/unemployed.
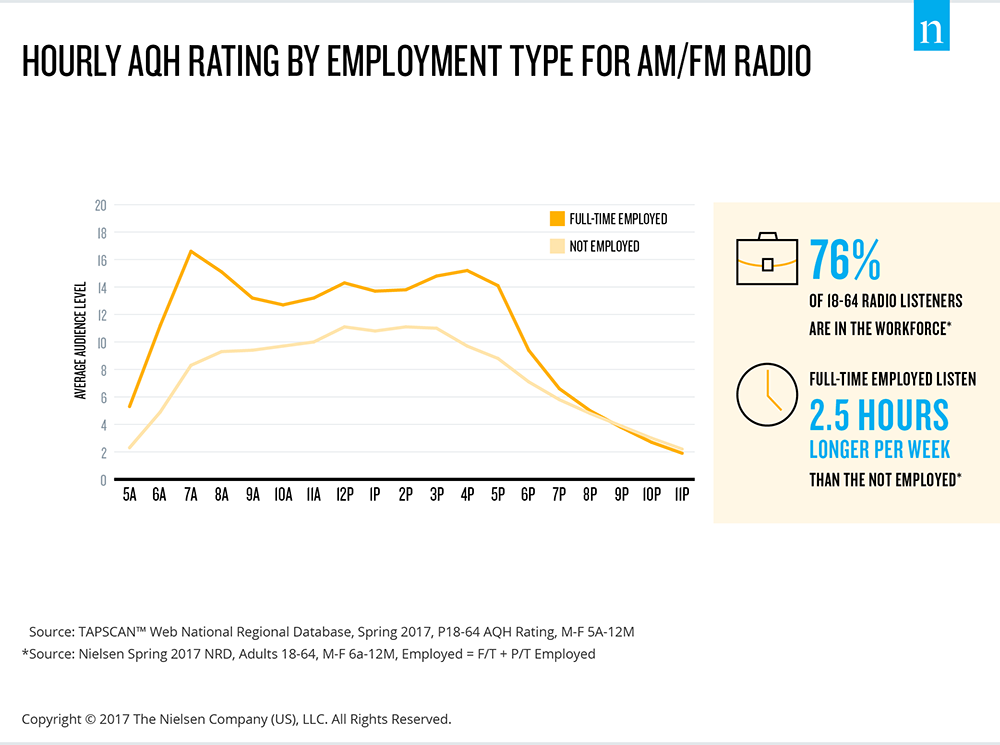 Adding to the appeal is the fact that traffic continues to be radio’s best friend – the average U.S. commute time is 26 minutes. Your travel time to work, of course, varies greatly by market – something that every PD and GSM should know.
As Nielsen points out, the programming and sales implications are obvious, reinforcing the value of drive time listening especially among the employed. And the data also points to the value of at-work promotion – something that many stations simply never emphasize, much less contest around.
As consultants, we’ve had great success (in both diary and PPM markets) for more than two decades with  various “Workforce Payroll” promotions and other related ways to celebrate the at-work audience that marry most of these vital statistics – and drive ratings.
Other streaming media may see peak listening show up at different times of the day or evening, but this Nielsen data reaffirms broadcast radio’s value as an effective drive time medium.
The bad
Nielsen’s “Radio On The Road” also reveals that more than two-thirds of radio listening takes place away from home – roughly three-fourths of radio consumption is out of home in both midday and p.m. drive.
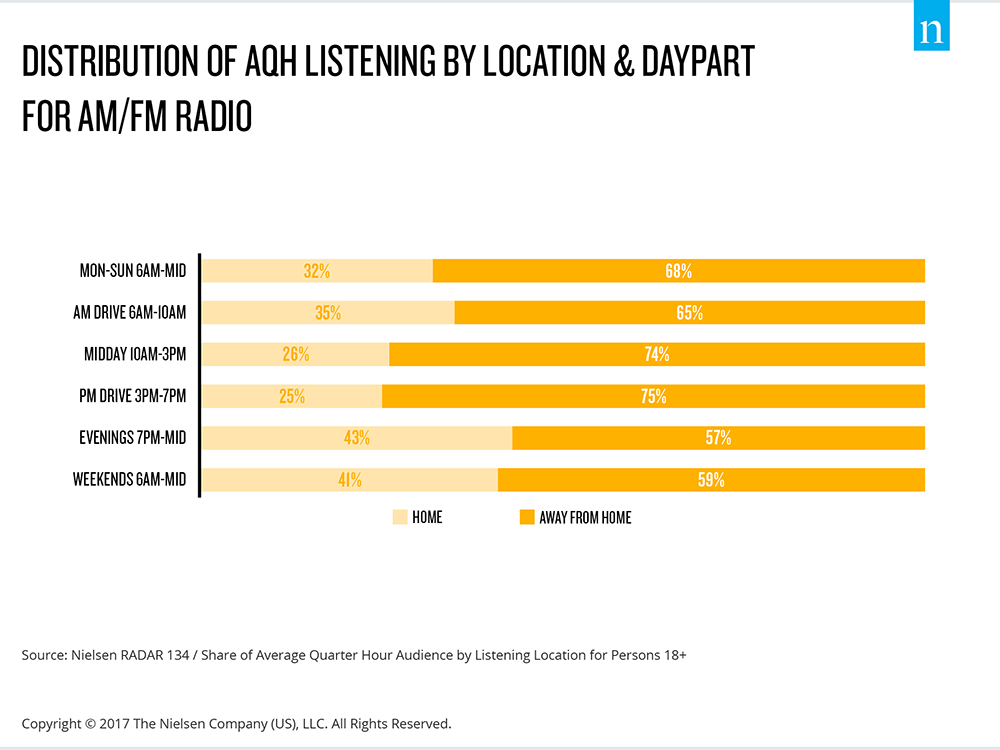
There are both big, fat numbers underscoring that radio listeners are on the go, they’re active, and they’re typically not homebound when it comes to their radio listening. (Of course, what this says about at-home listening is probably another reason your station should be seriously considering developing “skills” for Amazon Echo devices. Just sayin’.)
So, what’s the problem here?
Nielsen can’t tell us whether this away from home listening is taking place in cars, at work, or somewhere else.
And given the growing importance of the car on radio present and future, the lack of in-car listening data for PPM subscribers is maddening.
Sadly, this is one area where diary markets strangely have the edge over the nation’s biggest metros when it comes to ratings. Those check boxes under the “PLACE” column in diaries lets  respondents check off their location when they’re listening to radio – a key data point missing in PPM. The fact that radio broadcasters in Shreveport have this data but radio management teams in Seattle don’t is beyond paradoxical.
I’m not on the Advisory Council and I certainly don’t know the backend of the meter technology, but it would seem like there has to be a way to glean this information for both radio programmers and sellers.
At a time when the NAB on down is focused on in-car radio consumption, you’d think the ratings would be helping tell this very important story.
The truth
P1s have always mattered a lot, but they may matter even more now. Nielsen’s new data shows that radio listeners spend a whopping 58% of their radio time with their favorite station.
That suggests that P1s might be even more important to the overall health of the average radio station. We have long been believers in the 80:20 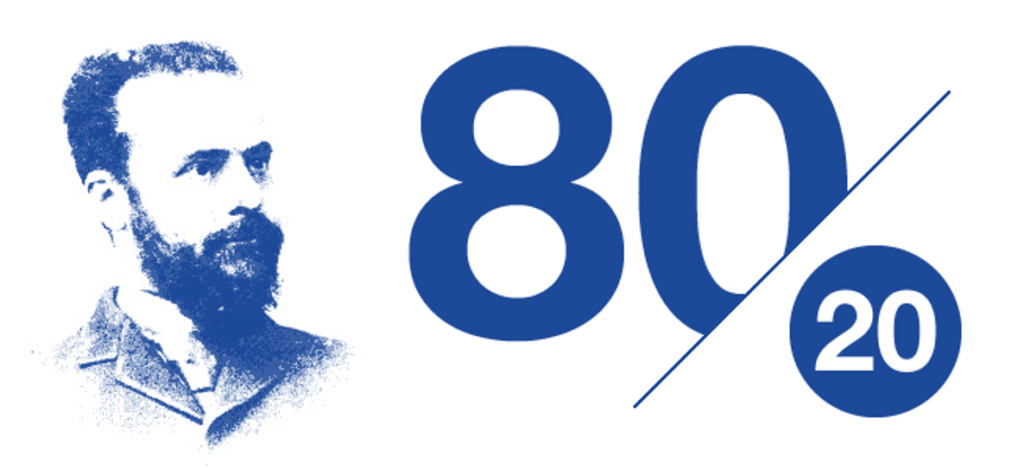 Rule (or Pareto’s Principal) that states that 20% of a population generates roughly 80% of results.
This new Nielsen data from Q2 backs that old 19th century philosopher up – and then some. And it also supports the underlying premise of our Techsurveys, often made up of mostly core fans of our stakeholder stations. I’ve especially heard public radio managers question our PRTS studies because they are so member-centric.
But these numbers from Nielsen clearly reinforce the need to understand your fans – what they think, what they need, and how to best serve them.
Perhaps this concentration of listening to single radio stations is an offshoot of the digital competitors that have infiltrated media time. As consumers gravitate to satellite and streaming radio, podcasts, and personal music collections, perhaps their radio listening time is more concentrated on just one radio station.
This is not to say that P2s or even P3s aren’t worth pursuing. Every listener – and every quarter-hour – counts.
But this fresh Nielsen data portends shifting sands underneath the audio listening audience. It ought to be a part of every strategic conversation over the next many months. And this trend should be carefully watched in future Nielsen releases.
Is the onslaught of digital media having implications on the ways in which consumers spend time with their favorite station?
Are certain formats more likely to vacuum up even larger shares of listening? What do these numbers tell us about the way radio deploys promotional and marketing dollars, especially when thinking across a cluster.
Like much great research, this Nielsen data raises as many questions as it answers. But it is provocative, useful, and worthy of your time.
Overall, “Radio On The Road” is a solid report that may have been missed, unread, or ignored in the constant deluge of daily news, blogs (yup), stories, and of course, the scores of emails that show up in our inboxes every weekday.
The next time you see an email from Nielsen, open it. It may not be an invoice – it could very well be a report with research nuggets that can help make you a better broadcaster, while helping you build your brand.
Register for Techsurvey 2018
Speaking of Techsurvey 2018, there’s still time to register. It will give you insight into how your radio station’s listeners are using new technology.
- The Hazards Of Duke - April 11, 2025
- Simply Unpredictable - April 10, 2025
- Flush ‘Em Or Fix ‘Em?What Should Radio Do About Its Aging Brands? - April 9, 2025



I always knew there had to be some significant drawback to PPM over diaries, but every time I’ve tried to dig into the subject, someone tells me I’m wrong to challenge the “superiority” of the electronic ear.
Now I not only know what the drawback is — lack of data as to where listening occurred — but why I was right to think whatever was nagging at me was significant.
To call this “beyond paradoxical” is an understatement on your part, Fred, and if the station groups in the PPM markets don’t call for action on Nielsen’s part to address it, then I think they should offer to opt-out at the next contract renewal. (And when the agencies start questioning station disappearances in subsequent “books” perhaps someone like yourself will be called upon to explain it to them.)
Again, KM, I’m not an engineer or a software developer, but if the WAZE app can tell you how fast you’re driving, surely the meter could be programmed to alert Nielsen the panelist is driving. The importance of the car to radio is only going to amp up over time. This is information that programmers and sales managers need. Appreciate the comment.