
In yesterday’s post, we tracked the success trajectory of public radio during COVID. In countless measures, AudiGraphics’ David Giovannoni provided proof positive that NPR News stations, in particular, enjoyed unparalleled loyalty throughout the pandemic.
His findings square with ours. We look at the Net Promoter Score as a key indicator of word-of-mouth, which translates into listener loyalty. The question that determines these scores is one you’re familiar with, especially if you’ve stayed in hotels, rented cars, and patronized consumer-facing businesses.
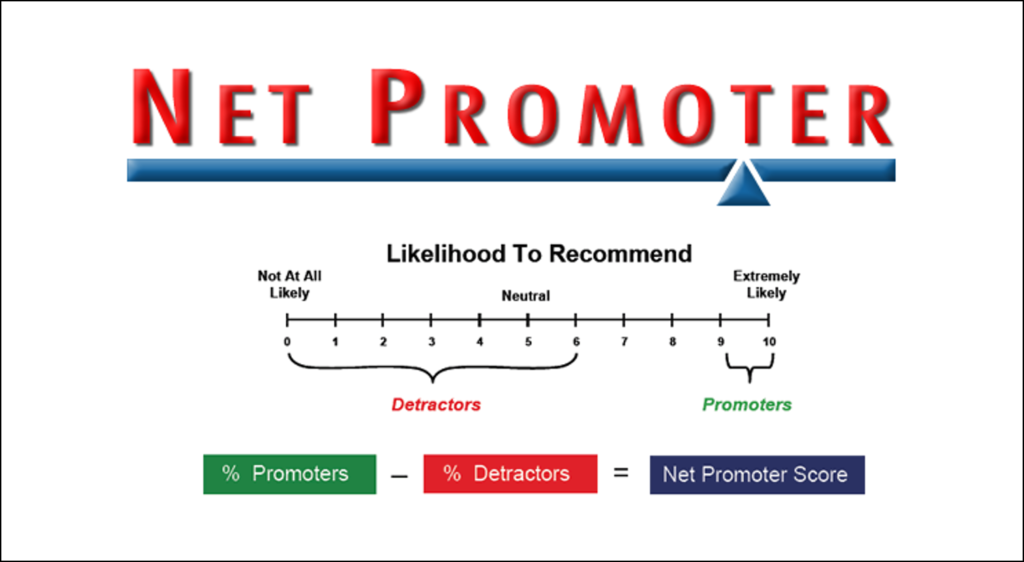
It asks on a scale of 0-10, where “10” means you’d be extremely likely to recommend, while “0” means you’d be not at all likely to recommend a radio station to a friend, family member or co-worker.
And passing this test is a high bar. You have to give a station a “9” or “10” score to be considered a “promoter.” A “0-6” score makes you a “detractor.” You take your percentage of “promoters,” subtract the “detractors,” and you’ve got your Net Promoter Score. And yes, the “7” and “8” scores are tossed. More on them later in this post.
In every Techsurvey we’ve conducted since 2004, in commercial, public, and Christian music radio, we’ve included the Net Promoter Score. And that has provided us with a key tracking mechanism, measuring a key performance indicator for radio (and any business that deals directly with consumers).
We’ve seen total scores move up and down over the years. And stations that become “stakeholders” year after year will tell you their NPS moves are typically attributable to what they’re doing on the air. Changing the music, losing a morning show, developing a strong new promotion – these variables are often “movers” of a station’s NPS.
As Gio pointed out in yesterday’s blog post, public radio success – especially its NPR News stations – has never been more wrapped up with its degree of listener loyalty. I’m happy to affirm his thesis. In last summer’s Public Radio Techsurvey – smack in the middle of the pandemic – we measured near-record Net Promoter Scores:
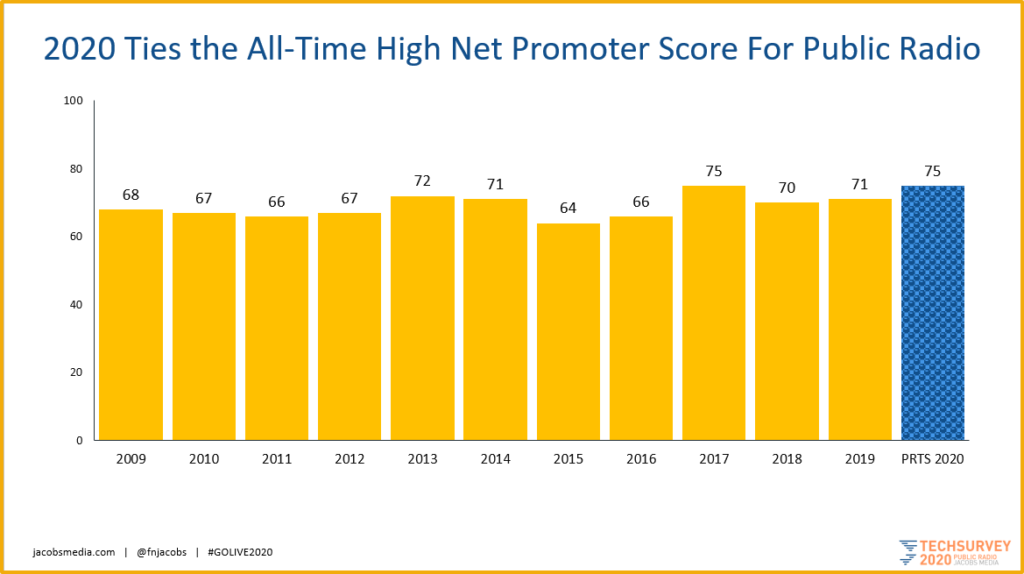
This is an impressive trend line, especially because of COVID when everything was disrupted.
But what about the commercial radio side? While its Net Promoter Scores are always lower compared to public radio, they actually set an all-time record in this new edition of Techsurvey fielded in January/February of this year:
![]()
Given how much heat and criticism broadcast radio takes these days, what can we discern from these improving numbers during the medium’s most challenging time? Did radio stations actually sound better in 2020 or did they fill an emotional need that differed from usual?
My conclusion is that it’s more the latter. While radio listening dropped due to in-car listening considerably slipping especially during the earliest months of the pandemic, many consumers rallied around their favorite stations.
 They gravitated to personalities and programming they were familiar with and they could count on. Stations that did an exemplary job of reflecting the local vibe – supporting local businesses and essential workers – may have helped power these all-important Net Promoter Scores.
As we showed in yesterday’s post, COVID accelerated some of radio’s losses. Due to WFH and other lifestyle changes, many people simply gravitated away from the medium. And others found listening alternatives in the form of streams, podcasts, and other options.
But for those who stayed in the fold, their connections to their favorite stations actually grew, and that’s significant. Radio’s listening levels may have taken a hit, but others became more appreciative of and engaged with their P1 stations.
How did individual formats fare this time around? While these numbers tend to bounce from survey to survey, there are some interesting findings this year:
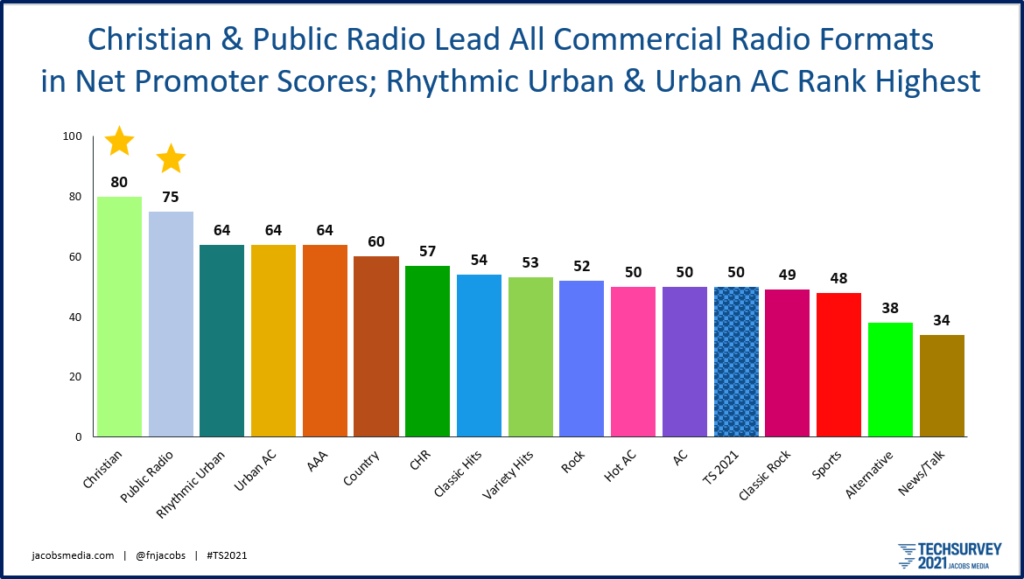
It’s hard to miss how strong both Christian Music and Public Radio stations fare on the Net Promoter yardstick. They typically lead the pack, but their COVID showings are exceptionally strong.
But many commercial radio formats acquitted themselves well. Note that Rhythmic Urban and Urban AC (along with a surprise – Triple A) clock in with a very strong NPS score of 64. In this tumultuous year when race was one of the nation’s frequent conversations, these formats that speak to their communities jumped ahead of the pack.
In general, the rest of the pecking order is similar to years past – although many formats scored higher numbers. We have been seeing tougher scores for both Alternative and News/Talk in recent years – and Techsurvey 2021 was no exception.
So, what do we make of all this data, and how can we put radio’s improved P1 standing in perspective?
First, COVID was a mixed bag. While radio listening declined, and still has not recovered in many markets, some stations benefitted from the foundation they laid in the past. Trusted personalities had a chance to connect with fans in far more intimate ways than was even possible in a COVID year. The pandemic shook most of us to our cores. And so trusted, familiar, empathetic, and resonant media partners may have had an edge.
But as David Giovannoni theorized in yesterday’s post, does this signify that while the core audience may have held (or even strengthened in some cases), the fringe may have eroded or become even less dependable.
So, what are stations tasked with moving forward, as we seem headed to a recovery this year.
First, it is essential radio broadcasters that continue to embrace and super-serve their core audiences.
Second, it is also not a forgone conclusion that fringe listeners will simply find their way back to your station – or radio altogether. While marketing dollars may be at a premium or even nonexistent, radio brands will need to marshal their resources to reconnect with former fans. Less pricey tools such as social media and email databases may, in fact, be strong avenues to reach lapsed listeners.

Stations would also be wise to take the opportunity to listen to their listeners – or former listeners. Focus and L.A.B. groups are an excellent, efficient, and generally inexpensive way in which to get a start. While testing the music or determining which station is “the concert authority” have value, there may be better and different questions to ask consumers in 2021.
And the last piece of the loyalty puzzle is those elusive people who gave radio stations like your a “7” or “8” on the Net Promoter scale – not good enough to be considered a “promoter,” but not mediocre enough to fall into the “detractor” bucket.
On some NPS scales, they’re labeled “passive.” While the inventors of the Net Promoter concept simply toss these folks, at Jacobs Media, we have always thought “Not so fast.”
We think of them as “Near Promoters” – people who are on the cusp of singing your praises. They are close to becoming core fans with the potential for loyalty, as well as spreading the word about your station to friends, families, and colleagues. Maybe they just need a nudge.
 Now it’s true some people simply won’t give anything a “10,” based on principle or who they are. Men also tend to be tougher graders than women. Same with older consumers.
But for these “Near Promoters” and their very real potential to make more contributions to your brand, what can you learn about them? What would it take to tip them into the “promoters” column? How are they different demographically from those who are giving you those “9s” and “10s?”
These are some of the questions that will be on the table as we roll out the results to Techsurvey 2021. Our more than 400 stakeholders will see their presentation, while getting their station level data later this month.
I’ll be putting together a custom version for Joel Denver’s “All Access Audio Summit,” a virtual conference that takes place in April. Details and registration can be found here. We will also be posting a slide deck on our website as well, so look for information about our data rollout.
This year of all years, the onus is on us to not just report the data – as in “this many said this” versus “this many said that” – but to dig into it, analyze it, and do some serious dot connecting.
The great news is that we have a lot to work with as we untangle what happened last year, as we try to understand the new landscape of 2021.
We’re looking forward to joining you on this journey.
- Media And Technology In 2025: Believe It Or Not! - April 18, 2025
- In Radio, You Just Never Know - April 17, 2025
- The Secret To Making A Great Podcast (And Great Radio) - April 16, 2025


Fascinating stuff, Fred. Some random thoughts on stats: It’s interesting that in many forms of measurement other than NPS, it’s not the middle scores, but the “highs” and “lows” or outliers that are tossed out to derive an accurate “truncated mean.”
Meanwhile, a golf exercise in goal visualization claims that if you hit each shot twice during a practice round, then took a total score from the BEST shots in each pair, that number would represent your POTENTIAL, given your skill set and conditions on that day.
Years ago a PD asked me to send air check tapes from two shows that week—one representing my best show that week and the other my worst. Wouldn’t you always just send two really good ones and claim one was your worst?
Looking forward to results from your curation of NPS scores.
Back when Howard was on all those Rock and Classic Rock stations, researchers were sometimes surprised his scores were always average – not super high but not low.
It was when they stopped averaging the ratings they learned the real story: on 1-5 scales, most people either gave him a “5” or a “1.” There were rarely “3s,” and I suspect that’s exactly how he would have wanted it.
Thanks, Dave.