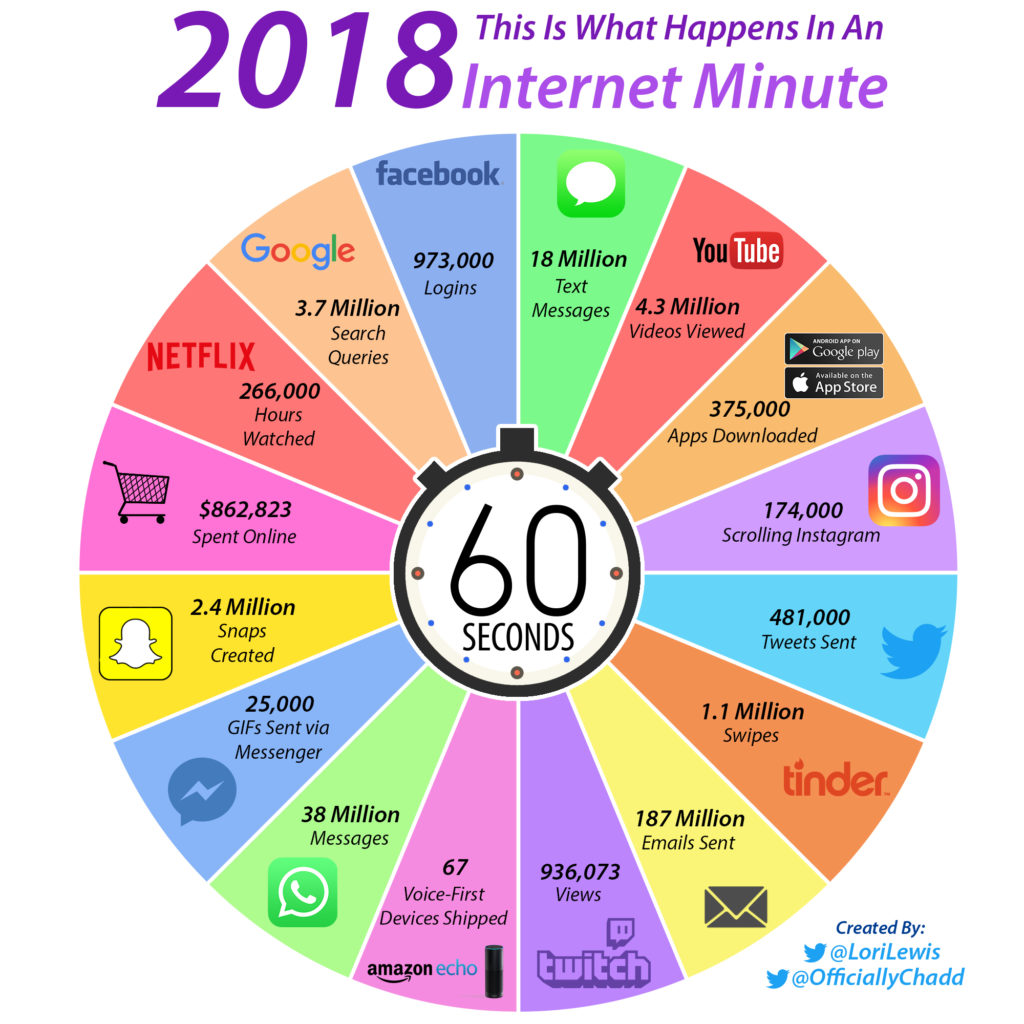
Perhaps you’ve seen this infographic before. Former Jacobs Media social media guru, Lori Lewis, has just published her newest “What Happens In An Internet Minute” clock – and it’s fascinating.
It’s not just about what happens in an average minute in the digital ecosphere. It’s how this activity is (mostly) accelerating for most brands and platforms. And some are exploding, which speaks volumes about how the radio audience (which is just about everybody) is also changing with these turbulent and exciting times.
Lori and I recently slowed down long enough to talk about these trends. As always, she has some great insights about what may be driving some of these changes. Of course, we’d love to get your “take” as well, whether it’s on our “Comments” section below or on Facebook and Twitter.
The entire impetus of our Techsurveys has been to better inform radio programmers, managers, and marketers about how the audience is engaged when they’re not tuned into broadcast radio. These infographics boil it down in a very compact, relative way – and by the way, they look a lot like what we’re seeing in our new mega-research study.
And by the way, online radio listening is not on this chart – and it should be. Lori and I both checked with Nielsen, and the calculus is of course, complicated. I’d love to see a radio “slice” of this pie – as long as the minute Nielsen chooses to measusre is not during the “bowtie” section of the radio clock. – FJ
Fred: When did you think of doing this infographic? What inspired you to come up with this?
Lori: I have always wanted to find a way to quickly snapshot the magnitude of today’s distracted audience, driving home why every second counts in what we do. Whether it’s on-air, creating content (for the station or advertising partners) or planning events. So a couple years ago, I stumbled on a graph that had laid out things we’re doing in our everyday lives. While it had some non-Internet activities, it inspired me to list what we likely do every day online while we’re listening to the radio (or even when we’re not).
This was going to be the illustration I’ve always wanted to share to help everyone stop for one minute and truly digest how we are battling like crazy for consumer bandwidth.

Fred: Why do you think it’s important? What does it tell you about our changing lives – as well as what’s going on with audiences?
Lori: If you look at 2017 and 2018 back to back, you clearly see living our lives online is not slowing down. I have long believed our image online is as important as our actual product. It’s where people are spending more and more time, whether they are alone or at dinner with family. Who we are, and how we’re behaving online, is critical.
It’s not going to save our brands – bad brands are bad brands – but excellent online presence differentiates great brands from the OK brands.
Fred: It’s interesting that almost everything is UP this year, like Instagram and Snapchat. That echoes Techsurvey BTW. So what do you think is going on?
Lori: While there are so many reasons, one could be phone plans. More providers are offering unlimited data which unleashes the Internet addict.
There’s also habits – they die hard. Habits of waking up to Facebook, tweeting at lunch, lurking Instagram before bed, keeping Snap streaks going…
Fred: Are you describing the audience – or YOU? Smart speakers took a nice rise, too. Thoughts?
Lori: Yes, sales tripled in 2017. I read a piece the other day how consumers are already demanding more innovation from brands when it comes to smart speakers. I’m nowhere near exploring Alexa the way I should – I still find it fascinating that I can tell her to play a radio station.
So I don’t know who these people are who want even more innovation from voice-first devices but clearly radio wants to pay attention to the demand.

Fred: Netflix hours watched/minute was almost 4x greater than in 2017. Wow, right? What does this say about on-demand content?
Lori: While I won’t reveal names, it’s amazing how many of my friends text me on a Friday night telling me about a Netflix show they binged on for 4 hours. Do people even go out anymore? I’m as guilty. It used to feel like Netflix shaming us when the dreaded question would pop up after hours of binging, “Are you still watching ‘Ozark?'” (or whatever show). It now feels more like a badge of honor.
“Yes, Netflix, in fact I am going on my fifth hour of ‘Ozark’ on a Saturday night!”
Also, going back to the increase in unlimited data – surely Netflix benefits from that, too.
Fred: Everyone writes off Facebook, but their engagement is up – by 73,000 log-ins a minute. Not dead yet?
Lori: Not dead yet. Facebook has a serious decline of usage among Generation Z. I predict Zuckerburg will report even more declines in time spent using Facebook through the year. But as far as the core user goes (over the age of 21), they aren’t going anywhere anytime soon.
I’m not sure the average user bothers with the breach of trust we’ve seen play out. The number of nonconsenting profiles (data) exposed in the Cambridge Analytica scandal recently increased from 50 million to 87 million and yet all I still see are “Hang In There, Baby” cat posters and vacation selfies. Facebook is so pedestrian compared to all social media platforms, and yet still the most used.
I get it. It’s easy, and it keeps people connected. Plus, their ad platform is stellar. I’ve had much success with it.

Fred: And what do you make of GIFs?
Lori: GIFs are life! Why use words when we can message a GIF? Someone asked me back in 2015 where social was going. I said, “GIFs, emojis and disappearing content.” So far I’m right, which is rare. This space is too fluid to call it. But I saw the usage three years ago skyrocket.
Fred: Where would Internet radio listening of broadcast stations fit in on this infographic?
Lori: I reached out to Nielsen about online radio listening but they didn’t have the specific data I was looking for. I wanted to add streaming radio, so maybe next year.
Fred: How much coverage are you getting on this outside of the radio industry?
Lori: A great deal of publications pick this up. What’s fascinating is they all stumble on it organically. I don’t press release it – I sit back and watch it grow through the year. It took a few months for it to hit peak share last year.
I like how people find it because of someone else. One of my favorite “shares” of the graph last year came from a guy who tweeted at me, “I have seen this in my News Feed multiple times and decided to finally share it myself.” So many people request to use it in presentations or folks send me photos when they see the graph in presentations they are sitting in.
All I wanted was to visually share with our industry what’s happening beyond the airwaves. I get a kick out of every single person who shares it, uses it, teaches from it. We’re all in this together. So it’s my small way of helping out.
Fred: Congrats, it’s very cool. Let’s see how much sharing it gets today. Thanks, Lori.
Note: Lori Lewis is VP/Social Media for Cumulus. She is also Board Chair for Conclave and is putting together another stellar agenda for this event.
Email Lori here
More info about Conclave 43 here
- What Is It With Female Robot DJs? - April 30, 2025
- Why “Dance With Those Who Brung You” Should Be Radio’s Operating Philosophy In 2025 - April 29, 2025
- The Exponential Value of Nurturing Radio Superfans - April 28, 2025


Funny thing is, ALL of these platforms can be used WHILE listening to the radio – unless the user is streaming using a radio app.
One of the great strengths of radio, Troy. Thanks for commenting.