Clear Channel’s new study about digital media habits, published by a number of radio trades, caught my eye this week. As an industry friend confided to me, there is simply too much research and data coming out for the average radio manager to absorb.
He’s right. I realize that Jacobs Media may be part of that “problem,” as our Techsurvey9 is a research gift that keeps on giving. Our format-centric webinars continue to be eye-openers, hopefully providing guidance to radio execs from around North America. But it’s a lot of data, and when you read about a new research finding or study each day, it can get to be a bit overwhelming.
In this new Clear Channel study conducted by the widely respected Vision Critical, one of the big headlines revolves around the fact that women are more gadget-centric than men. Their survey of more than 1,000 respondents across America shows that for both tablets and smartphones, females are now in the lead.
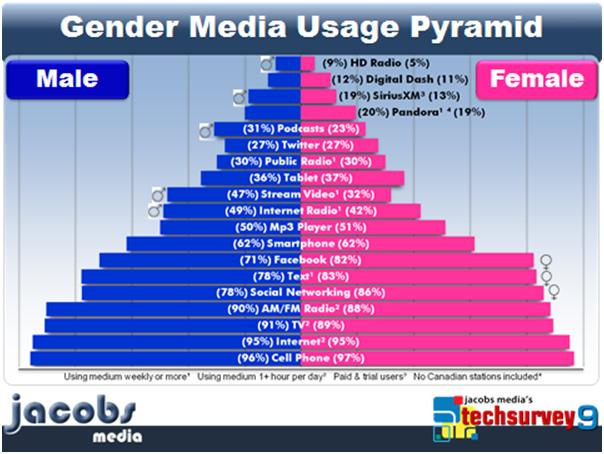
That’s an interesting finding to be sure, so I checked our Media Usage Pyramid that breaks down male versus female media habits and gadget use. And that’s not what our data shows:
We show a dead heat for smartphones and only a 1% lead for tablet ownership among women (not a significant difference). In fact, while we’ve witnessed women catching up with men tech-wise over the past few years, we’re seeing equality among the genders for gadget use. So in comparing one research study with another, these discrepancies are to be expected, because of methodological, sampling, and questionnaire differences.
In our pyramid, we see other key gaps in this techno battle of the sexes. Using the familiar symbols (♀, ♂) to highlight those differences, the pyramid shows that men are more into streaming (audio and video), podcasts/on-demand, satellite radio, and yes, even HD Radio. Women, on the other hand, are well out in front for texting, social media, and specifically, Facebook).
Part of better understanding research is to consider your real life experiences – from focus and L.A.B. groups to general interaction with people – to provide validation for the research you read about. How do various findings hold up against your personal dealings with people? Do they ring true or do they seem exaggerated, far-fetched, or perhaps there were problems with the questions being used?
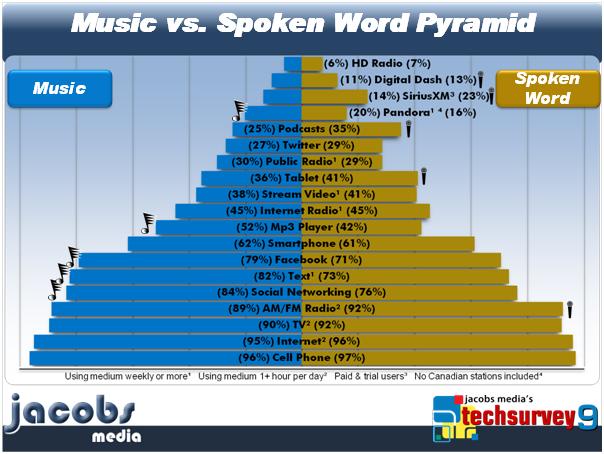
I’ll give you one more. There’s been a lot of talk about music vs. spoken word formats. So the question is whether listeners who are P1 to these very different styles of radio are….very different. Here’s the pyramid that should settle the arguments, as well as provide programmers and managers with the guidance they need to make better decisions:
The little musical notes and microphones illustrate some of the media, technology, and gadget gaps. For fans of music formats, there’s a greater tendency to be involved in social media, specifically Facebook, as well as ownership of an mp3 player, and weekly Pandora listenership. Makes sense, doesn’t it?
And for spoken word partisans, there’s a tendency to listen to a little more broadcast radio, as well as tablet ownership, podcast/on-demand usage, SiriusXM access, and driving a car with a digital dash. And while music lovers may be more social media-centric, note how Twitter actually skews a bit more toward the Talk crowd (driven heavily by Sports Radio fans).
So back to that question of “Is there research overkill?” And I would suggest that perhaps you think about it this way: The key to great research is whether it’s actionable. And the value of a good researcher is his/her ability to help you connect those dots.
That is, is the research simply reporting data, or is it providing you with connections and steps that you can take to improve your brand? Our philosophy is that data needs to lead to the creation and improvement of brand strategies. For example, when you learn that many radio fans start their day by checking their email, an obvious tactic is to use your database as a recycling tool to move – or “pinball” – your audience back to your air by promoting something you know they like on today’s show. Similarly, our data about which smartphone platforms are most popular – by format – should serve as guiding information for stations developing mobile strategies that are most resonant to their fans.
So while there may be a little too much data out there when you read your radio trades and check your email every morning, I look at it differently. Never has there been so much information for curious, clever, and insightful programmers who are bright enough to apply it to what they do every day.
If that sounds like you, there’s more to come. With 264 stations participating in Techsurvey9, producing more than 78,000 respondents, we’ll be ready for our tenth anniversary landmark research study in early 2014. We invite you to take the plunge with us.
It’s about great data that you can use – and that’s our goal.
If you’d like to participate in a free webinar with Techsurvey9’s top-line results, it’s courtesy of The Conclave, Tuesday June 5 at 3pm ET. Register here.
- Media And Technology In 2025: Believe It Or Not! - April 18, 2025
- In Radio, You Just Never Know - April 17, 2025
- The Secret To Making A Great Podcast (And Great Radio) - April 16, 2025


Leave a Reply