
If you were a program director in radio in the 80’s or 90’s, chances are you had your brush with “The Grid of Pain.”
It was a guide that often came with a perceptual research study. After spending hours reviewing your station’s strengths, weaknesses, images, and perceptions, it was time to set some goals. Oftentimes, the researcher and the general manager would turn to the PD and ask a question that went something like this:
“So, what level of success will we reach by the Fall Book?”
And the discussion would take place. What was realistic? What was the competition up to and what might we expect? What type of contest and marketing budget did we have and what were we going to spend it on?
But the real question was this:
How were we going to get there from here?
And for that, there was “The Grid of Pain” – an elaborate chart teeming with numbers. It was a depiction of the relationship between time spent listening that runs down the left side of the chart, the cume – total weekly audience reach across the top. Where the two axes intersect is the station share, expressed as a percentage.
To make things convenient and highly useful, every station in the market was plotted on the grid, including your station.
At a glance, you could see how the competition stacked up. Which stations leveraged a small cume with high listening duration? And conversely, which stations were all about their big cumes, but had challenges holding that massive weekly audience.
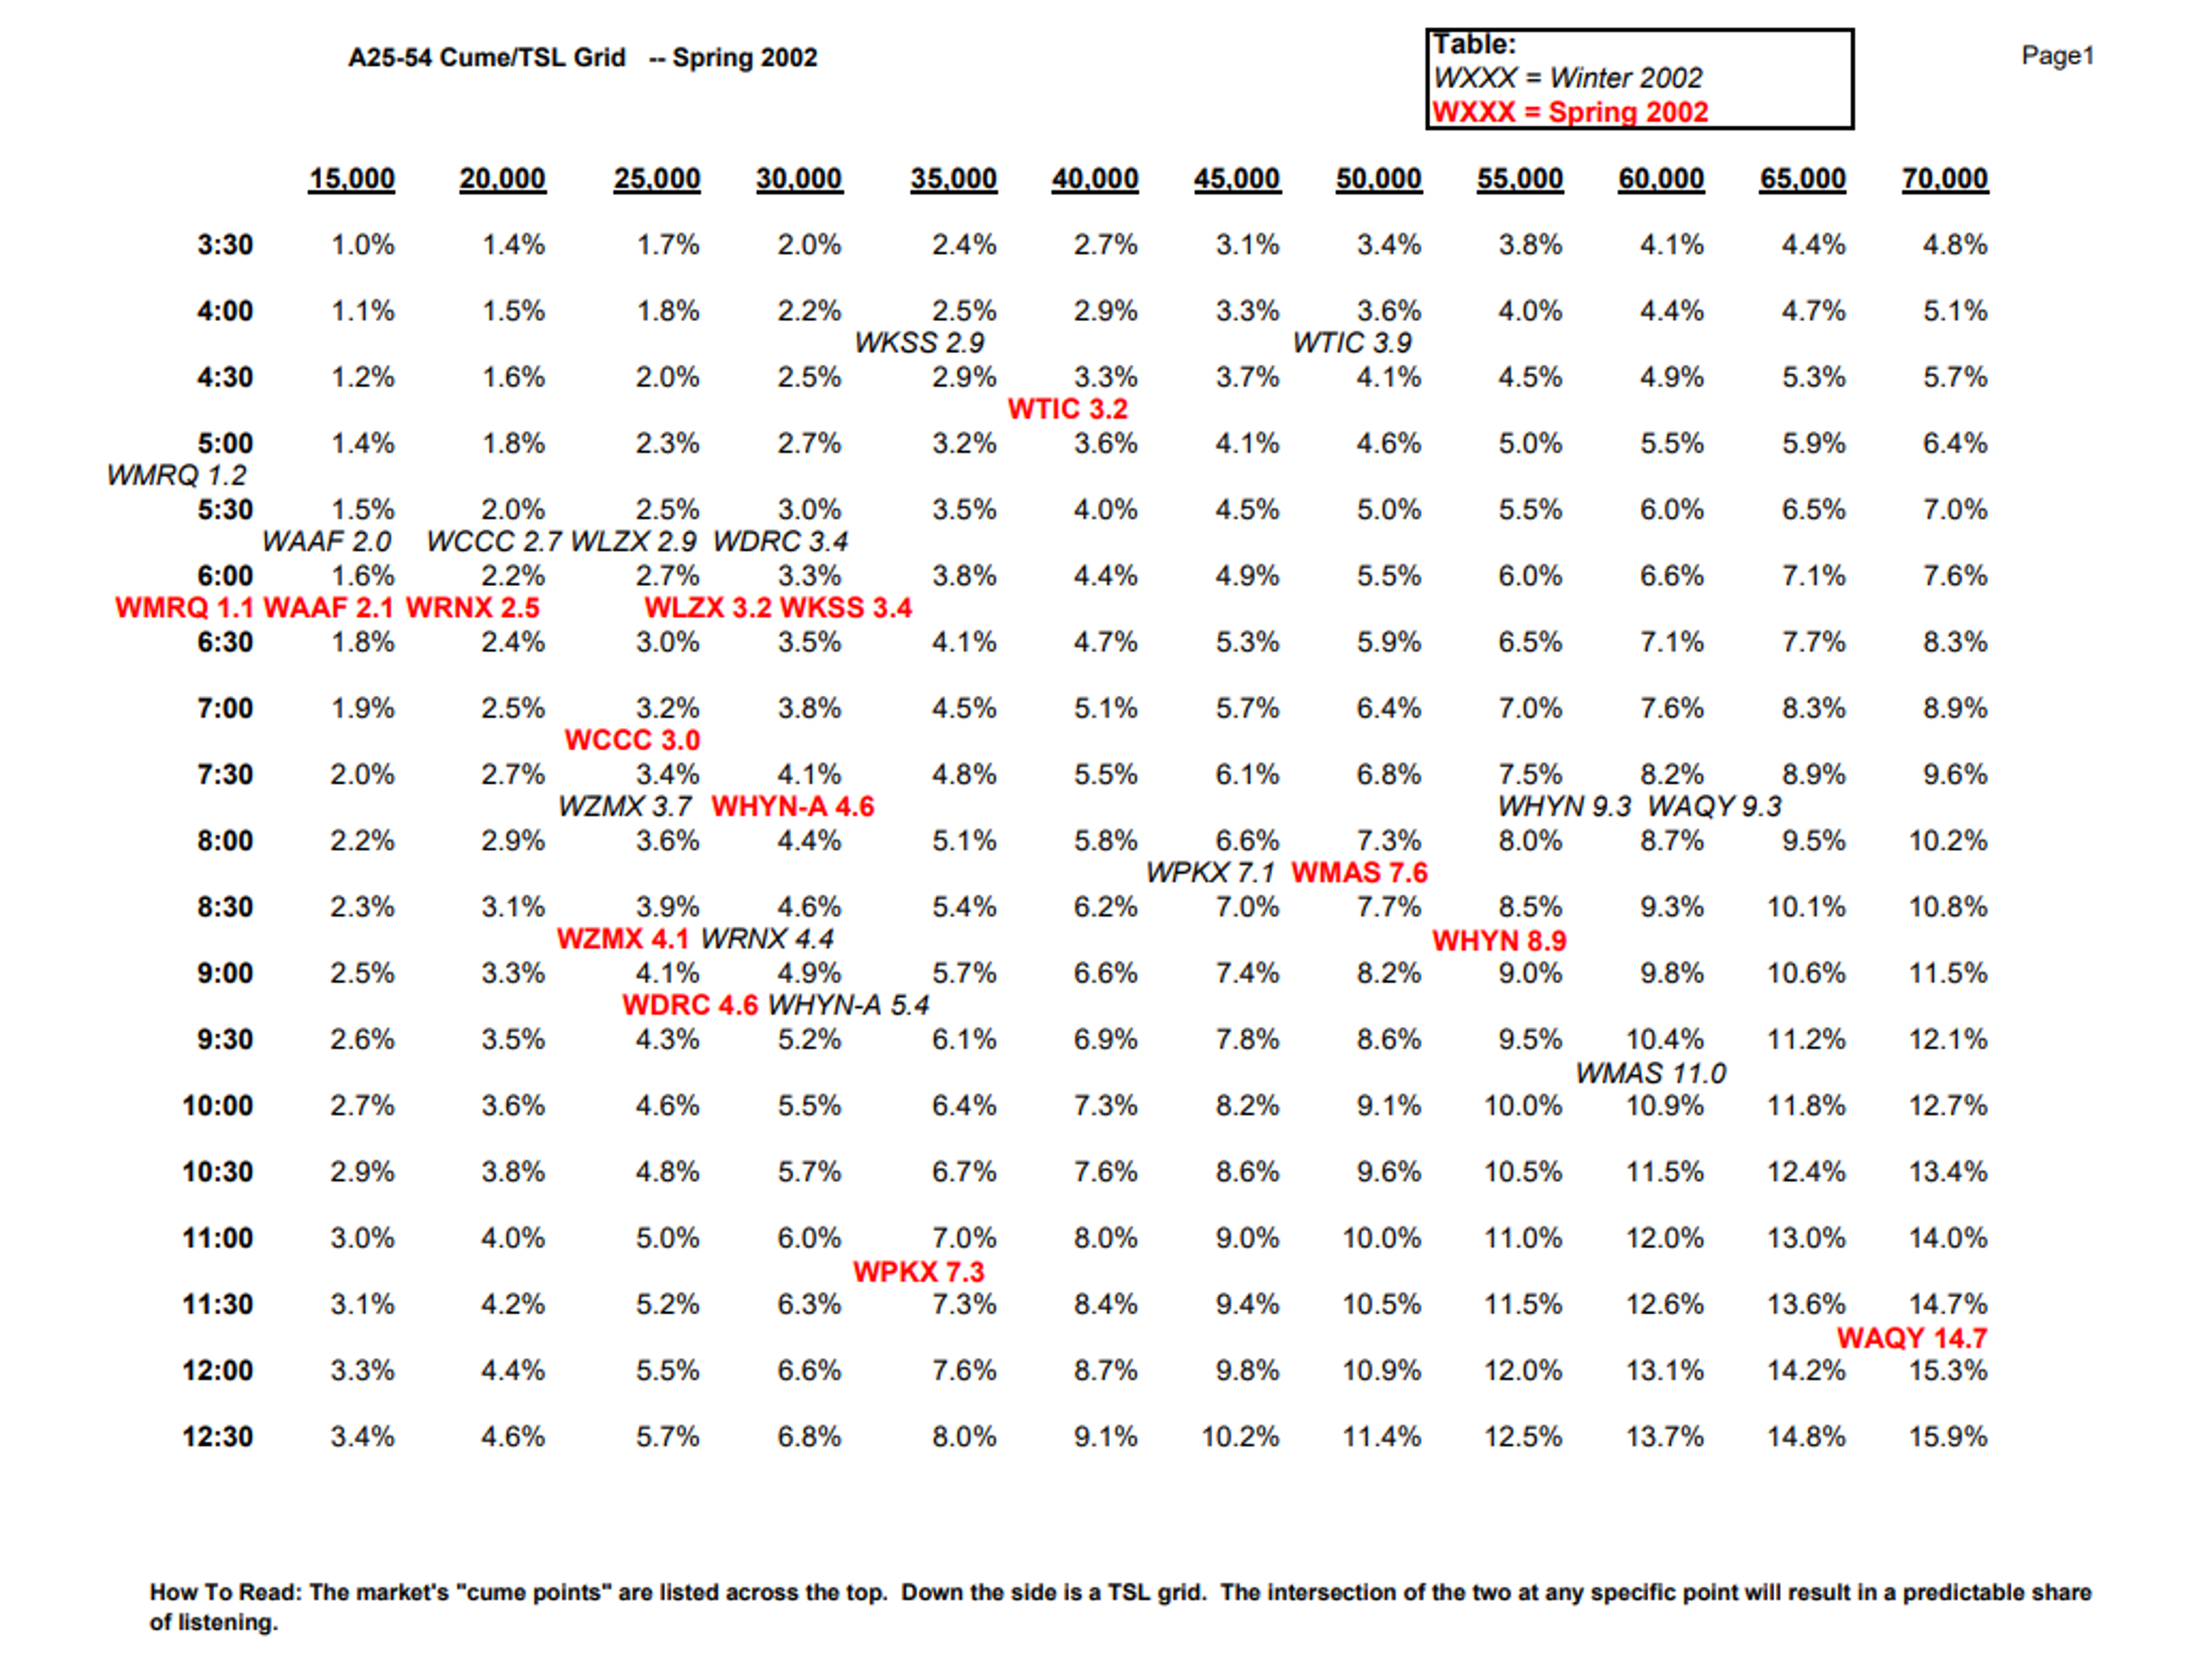
The more you studied the grid, the more certain truths became clear. In order to reach the station goal, something had to move up. Perhaps you had to hold that cume audience, but coax them into listening another 30 minutes a week. Or maybe the idea was to somehow maintain your listening level while growing the cume another 10,000 bodies during Arbitron’s 7-day diary measurement period.
It was often a game of whack-a-mole. If you got your cume higher, your TSL dipped. Other times, you’d fall out of bed with men, while experiencing spikes with women. And of course, all the while, programmers dutifully played the game, investing in TV buys and contest dollars to jack up that cume. Or focusing everyone’s efforts on eliminating the “tune-outs” to promote longer listening.
Sometimes, it actually worked. An imprecise ratings system would actually yield the desired result – at least until the marketing money ran out. Sadly, things often had a way of settling back into “normal.”
I was thinking about the dreaded grid the other day when I read a story that transcended both cume and TSL because it was all about engagement. That’s a word that was missing from the calculations. And while it is an often overused words in our 21st century of radio programming, there’s a lot to be said for how we might envision what success looks like in world where broadcast radio is one of many entertainment and information media platforms.
The story was written in Buffer by Tamilore Oladipo called “Advice for Growing an Engaged Audience (featuring Top Creators).” And like she was sitting in those radio strategy meetings from years past, Tamilore tells us that if it’s just audience growth you’re after, “there are a million and one tactics out there.”
Loyalty and engagement are whole other things, and she consults creative types to explore ways to engender them. These include focusing efforts on niches, rather than trying to be all things to all people.
 Another suggestion is to be less dependent on metrics – especially “vanity metrics” like page views or likes. Rather than creating and posting “click bait,” the advice revolves around authenticity. As Oladipo counsels, “Instead of trying to game the algorithm, create what you wish existed and find others who share that vision.”
Not being hesitant about “going cross-platform” is another smart idea, especially given our journey in radio where broadcasters exerted much effort in encouraging listeners to focus nearly exclusively on the terrestrial signal.
The Buffer article underscores the importance of building email lists and trying other platforms, or using other social media sites in order to protect an audience. These activities also reduce your brand’s dependence on just the tower and transmitter.
Another way to think of the challenge is to establish “content pillars” – the foundation of a brand’s output. When stations lean into those building blocks – a core music sound, a community cause or charity, a commitment to local music, news content that resonates – it provides cohesion in everything a stations does. Tamilore says these “pillars” build and strengthen “trust and loyalty among the audience, leading to long-term engagement and growth.”
One thing that hasn’t changed in radio or in brand building – knowing your audience. Most programmers, managers, and owners of radio properties will tell you this key step is covered. But they may not be as in touch with their listeners as they think.
It’s one thing to study the metrics, whether it’s digital usage data or the ratings. It’s another to truly know who they are – apart from the station format. Too often, it’s an area where programmers come up short, often no fault of their own.
Audience research has become too rare or it focuses on perceptions designed to conquer “The Grid of Pain.” Instead, it often comes up short on insights. Who are these people when they’re not listening to Country, Hip-Hop, Classic Rock, or baseball and football games?
Where do they spend their time and their money? What are their other interests? What tenets and principles are near and dear to them? What brings them joy? What do they celebrate?
Engagement is more than turning up the radio when a good song comes on or leaning into a topic on a talk show.
For leading indicators, I have come to count on a troika of key questions in our Techsurveys. Now keep in mind most respondents are core radio listeners – people who by and large are members of station email databases.
The first marker relates to word of mouth – recommendations from others. We get emails from Netflix and Disney+ all the time with suggested shows to watch. But when a trusted friend – who knows you – suggests you’ll love a movie or TV series, it matters. Greatly.
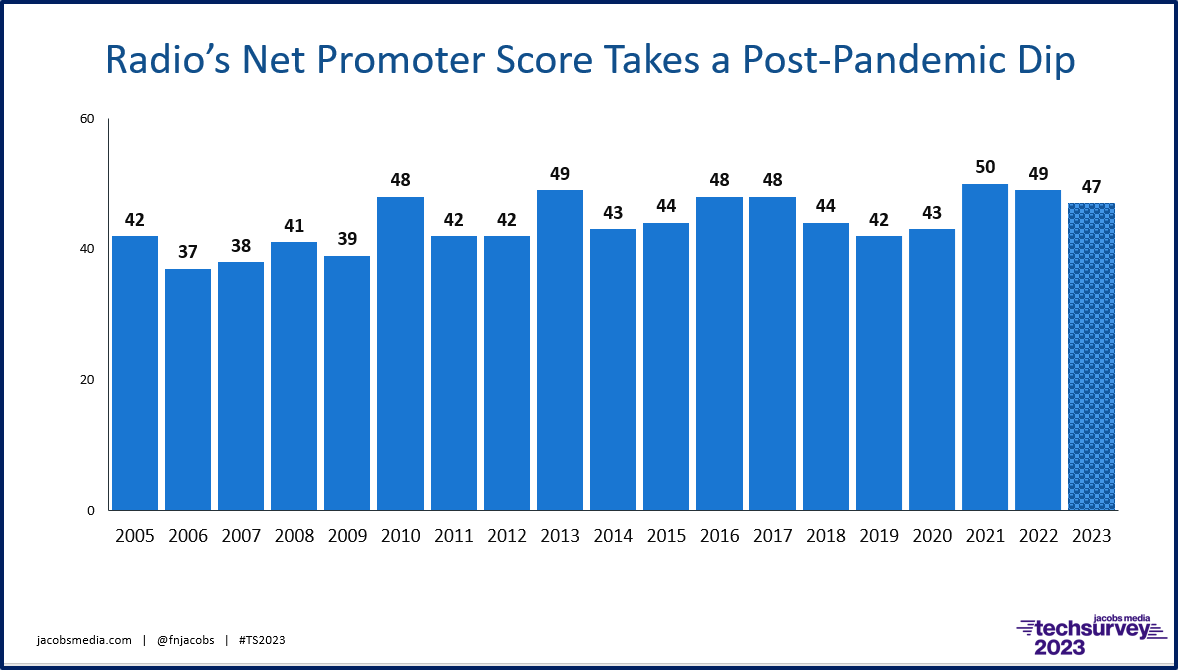
Our Net Promoter Score question handles the job quite well, asking respondents whether they’d recommend your station to a friend, family member, or colleague. We’ve been asking it – and trending it – for almost two decades.
The chart below is from our new 2023 report, trending each year, an interesting way to look at commercial radio’s power of “word of mouth.” But Techsurvey “stakeholder” stations have been charting their engagement for years, based on their unique Net Promoter scores.
The second litmus test is a simple one – we come right out and ask respondents whether they feel a sense of connection to the station that sent them the survey.
We’ve haven’t asked this one since Day One, but we have some solid trending – especially before, during, and after the COVID pandemic. It’s a simple agree/disagree statement:
“I really feel a sense of my connection to the station that sent me the survey.”
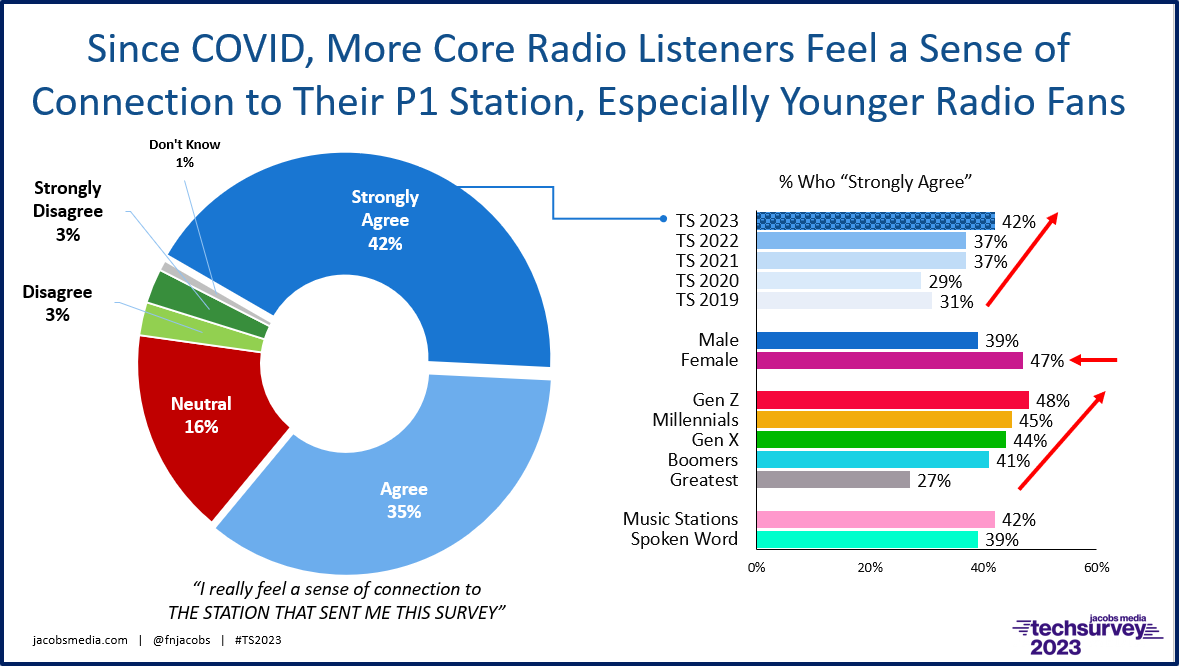
During these past few years, we’ve discovered how those who still use radio as a primary medium have developed stronger connectivity with their favorite stations. Again, it’s another indicator, and it something individual stations can check, as well as track over time.
It shouldn’t be lost on us how women and progressively younger listeners are more apt to feel a stronger connection with their most-listened-to stations.
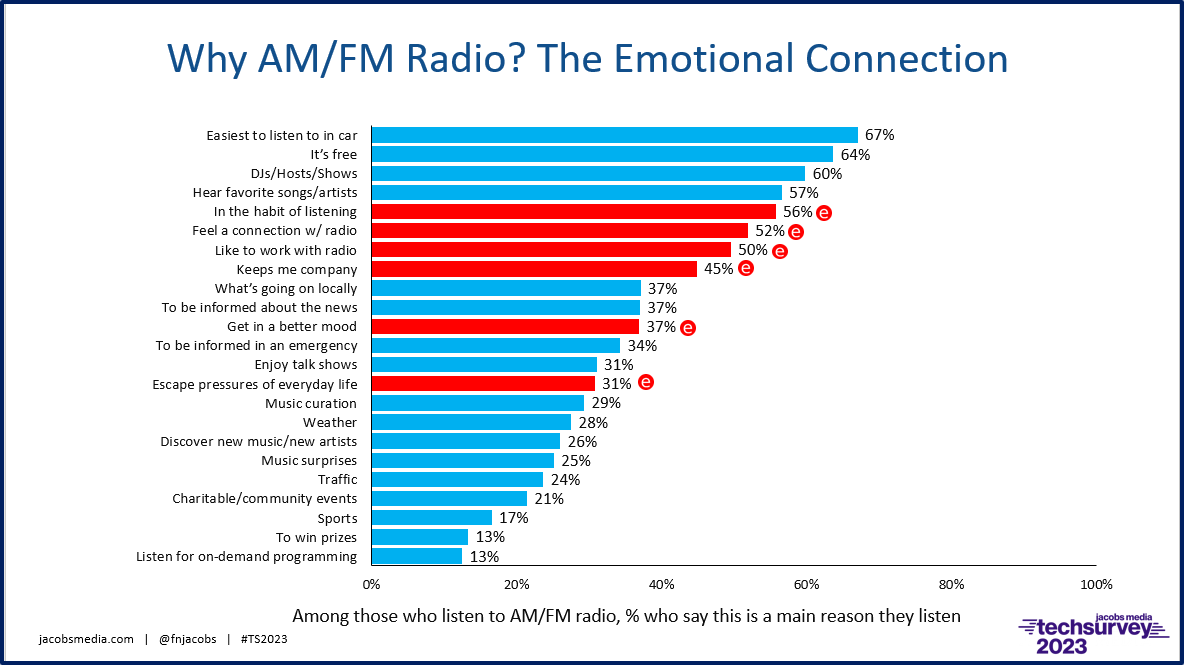
And the final piece of the Techsurvey triad – the “Why Radio?” question. You’ve no doubt seen it (and its many versions) in my presentations over the years.
It simply asks survey takers to tell us the “main reasons” they listen to broadcast radio, choosing from a long list of possible assets. Again, I always show the full sample’s response or perhaps a format breakout.
But the “gold” is when you look at the data from the perspective of an individual station.
Still, it is revealing in its totality. Sure, music and personalities are major drivers. But when we pull back from the chart and look at a number of emotional benefits people derive from their favorite station, it’s a long list. Radio is habit-forming, nice to have on while you work, it’s companionship, a mood elevator, and even a stress reliever. Of course, these results vary by the station and the makeup of its core audience. But as Tamilore Oladipo would no doubt concur, there’s a lot of engagement on this chart.
I’m not sure I could ever compete against “The Grid of Pain.” But Techsurvey offers a tripleshot of metrics that go a long way toward explaining and even quantifying engagement, an often nebulous quality. As programmers and marketers, we desire it. Too often, it is difficult to actually nail down what it means for radio listeners to feel like they have a relationship with a station.
In our current ecosystem of brands, platforms, A.I., and other entertainment and information options, gaining this understanding might go to the core of whether today’s radio brands can viably compete down the road.
Of course, anything’s better than facing “The Grid of Pain.”
I was unable to gain a sense of who actually invented “TGOP.” Some point to David Lebow, brilliant analyst and strategist who used it with aplomb. Others point to former Arbitron (and latter Nielsen) exec Bill Rose. I’m sure I’ll hear from those who will claim to know. – FJ
- Media And Technology In 2025: Believe It Or Not! - April 18, 2025
- In Radio, You Just Never Know - April 17, 2025
- The Secret To Making A Great Podcast (And Great Radio) - April 16, 2025



You don’t want to see sausage made and that goes for the Grid of Pain too. Sitting in that closet in Laurel going through those plastic bins looking at how precarious your livelihood was!
It was like spending a day in prison, Todd. Unsettling, uncomfortable, scary, and you couldn’t wait to get the hell out of there!