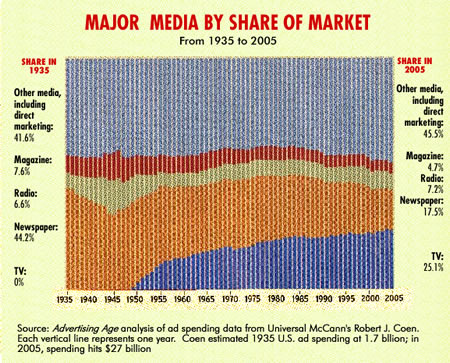
In its first issue of 2007, Advertising Age printed a fascinating chart, showing major media market share over time. Usually these analyses go back a decade or so, but the Ad Age chart compares 2005 spending to the same levels in 1935 – a 70 year time span. And what a story it tells.

Several things will get your attention…
Newspaper spending has catastrophically gone down, starting at around 44% in 1935, getting hit heavily by TV in the ’50s, and now dwindling down to less than 18%. Magazines have also had a tough road.
But then there’s radio. The interesting thing here is that radio in 2005 is at roughly that same 7% threshold as it was in 1935. It had a great bulge during WWII when it peaked at 14.5%, but then took a major bath in the ’50s when television became the rage. In 1956, Ad Age notes that radio fell to 5.6%.
Yet, radio recovered. And as Ad Age points out, "The fall and rise of radio should offer hope to old media."
You can only imagine what radio execs were going through in the late ’40s and early ’50s when it started to become obvious that "new media" – in this case, television, was going to become the new star. Yet, radio persevered, reinvented itself, and lived to fight another day. Radio programmers during that era essentially threw out the old model, refocused the medium on music and local entertainment, and found a way to survive.
"It’s different this time" may be the mantra you’re saying to yourself as you read this. But there were very likely many doomsayers back in the ’50s, too, and yet somehow, radio pulled it off.
You never know.
- Media And Technology In 2025: Believe It Or Not! - April 18, 2025
- In Radio, You Just Never Know - April 17, 2025
- The Secret To Making A Great Podcast (And Great Radio) - April 16, 2025


This is a great chart, thanks for posting it because I missed it in Advertising Age. The only aspect missing from this chart is an analysis of media fragmentation over the same time-period.
By industry, this can be very telling:
Radio: Total share is roughly the same, but there are exponentially more stations today than in the 1930’s and this does not include satellite radio, HD radio, etc.
Newspaper: In addition to total share evaporating, the number of papers has sharply declined. In the 80s and 90s, most markets became one-paper towns. Very few cities have multiple major papers today.
Magazines: Print is bleeding dollars. The most disturbing part of the Time Inc. situation is that even successful magazines are experiencing layoffs and closures.
Television: From the 50’s to the 80’s most homes were able to tune three stations on their televisions. The average home today can tune more than 100 channels.
The point is that even in growing traditional media, like television, shares for each individual network and each local market station continue to become more and more fragmented. Audience behavior is getting harder to predict, and trends are over by the time they are identified.
An excellent chart, to be sure, but traditional media still has quite a bit to worry about.
–Carter