In radio, the sands are shifting. In the wake of the COVID pandemic, usage patterns are changing as habits and routines have become disrupted. You know this if you study the ratings or your research – or if you spend time talking with consumers about their entertainment and information habits.
It used to be that cutting-edge media and technologies were the realm of what we referred to as “digital natives,” young people who never knew a time when there wasn’t social media, smartphones, Facetime, and Spotify.
But today, these gadgets and platforms are becoming second nature to their parents – and often, their grandparents.
 Case in point: we conducted focus groups among a “mature” audience of Classical music P1s. We were expecting to hear how many were regularly using smartphones and playlist services to enjoy their music. But we discovered strong usage of YouTube as a music discovery tool. They’d hear a symphony or a piece on their favorite Classical station, and then they’d explore YouTube to find out more about the composer or the piece. And along the way, many would get caught up in the rabbit hole of music discovery.
It has become clearer to me that research has never been more important to the radio broadcasting industry, as old habits erode while new ones are formed. Yet, many individual stations and organizations don’t have the funds to conduct their own proprietary research.
I’ve never positioned our Techsurveys – in commercial, public, and Christian music radio – as substitutes for “the real thing” – market studies focused on a target population of local radio listeners. But as I’ve presented PRTS 2022 and even our air personality survey, AQ4, over the past several weeks, I’ve had more and more programmers tell me how vital these research studies have become to their thinking and planning.
That’s flattering and appreciated. But I can’t always get past the idea that at the end of a fast-moving hour of data dumping, many viewers get cross-eyed while looking at all those pie charts and bar graphs. Even as I try to tie together loose ends and summarize the key points, I’m often left with the feeling the data could be more actionable. And in the process, it could answer some of the important questions most programmers are grappling with.
I like to think of myself as a “data whisperer.” But to really excel at that high level skill, I’ve had to learn how to be a better listener.
Thus, I’ve made a more concerted effort to stare at the data, turn it on its side, cut it in different ways, and actually hear what it’s trying to tell us. Like any other skill, the longer you do it, the more likely you’re going to derive insights you didn’t see during your first few passes. I don’t care how long you’ve been doing it – leveling up is never easy.
Public Radio Techsurvey 2022 provides some great examples. I’ve discovered some things that might help make it easier for the decision-makers in Public Radio to think about some of the key questions on their plates. And to a great degree, it comes down to how you cut the data.
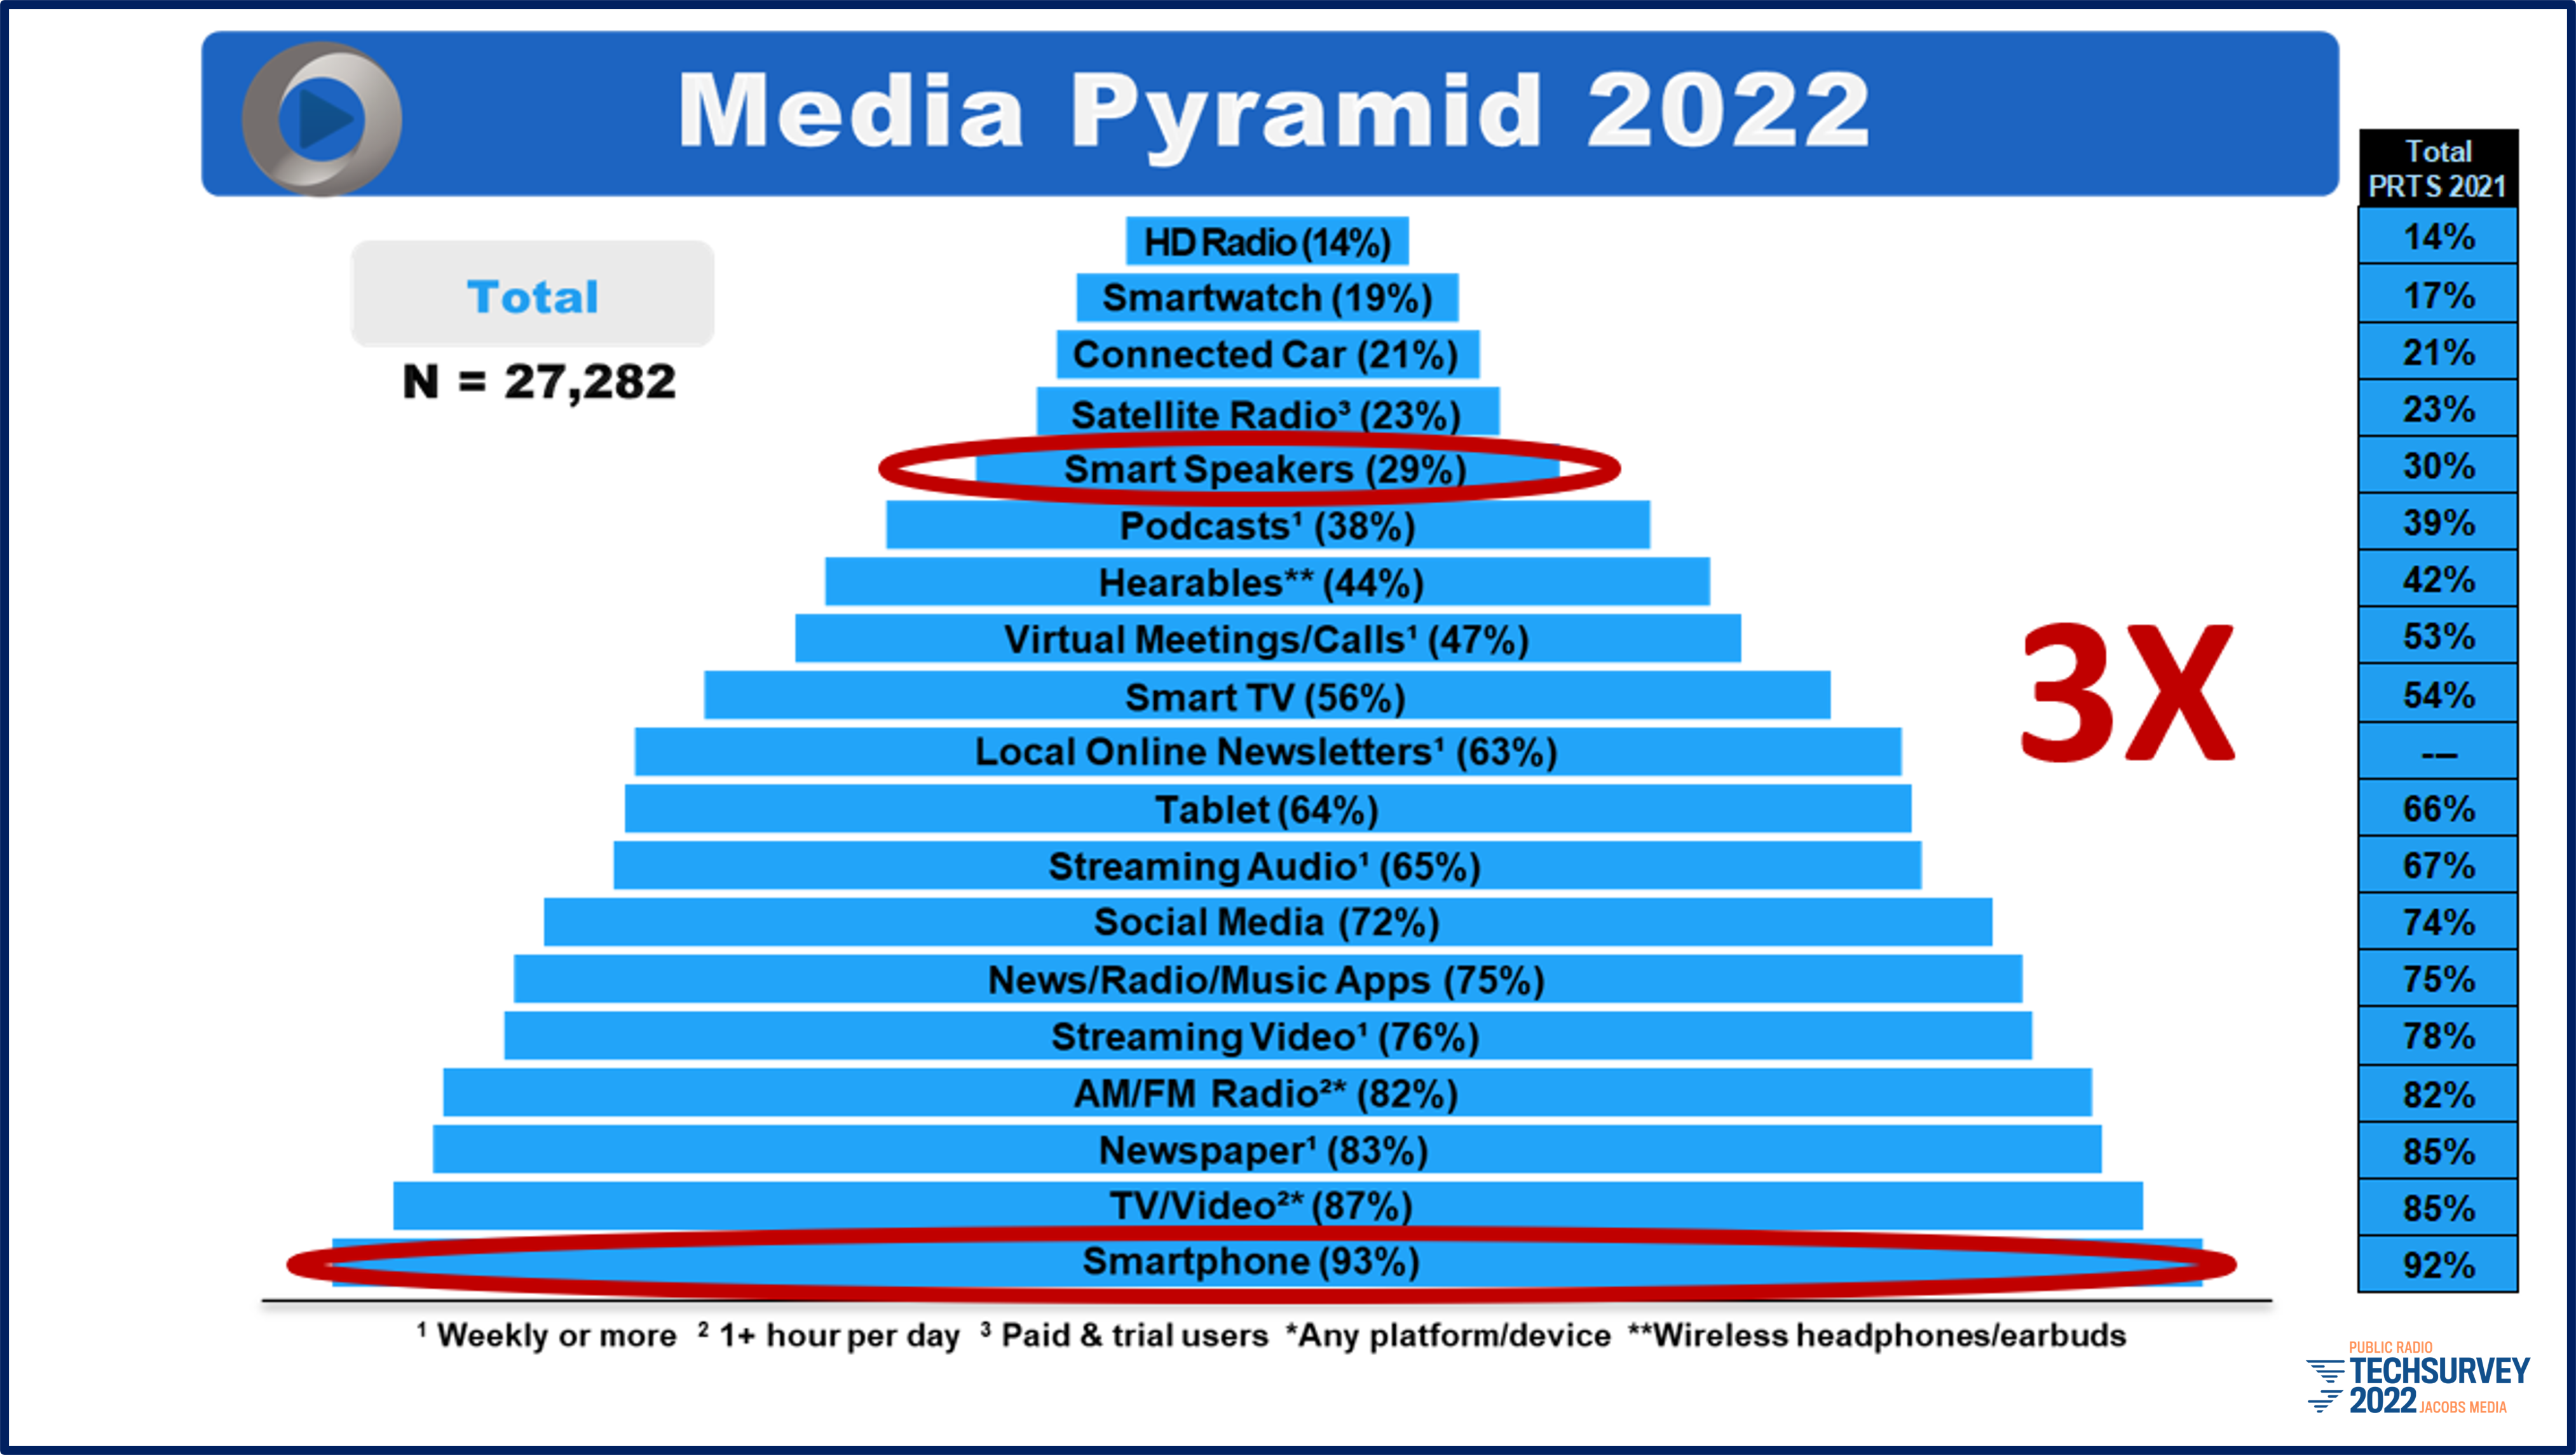
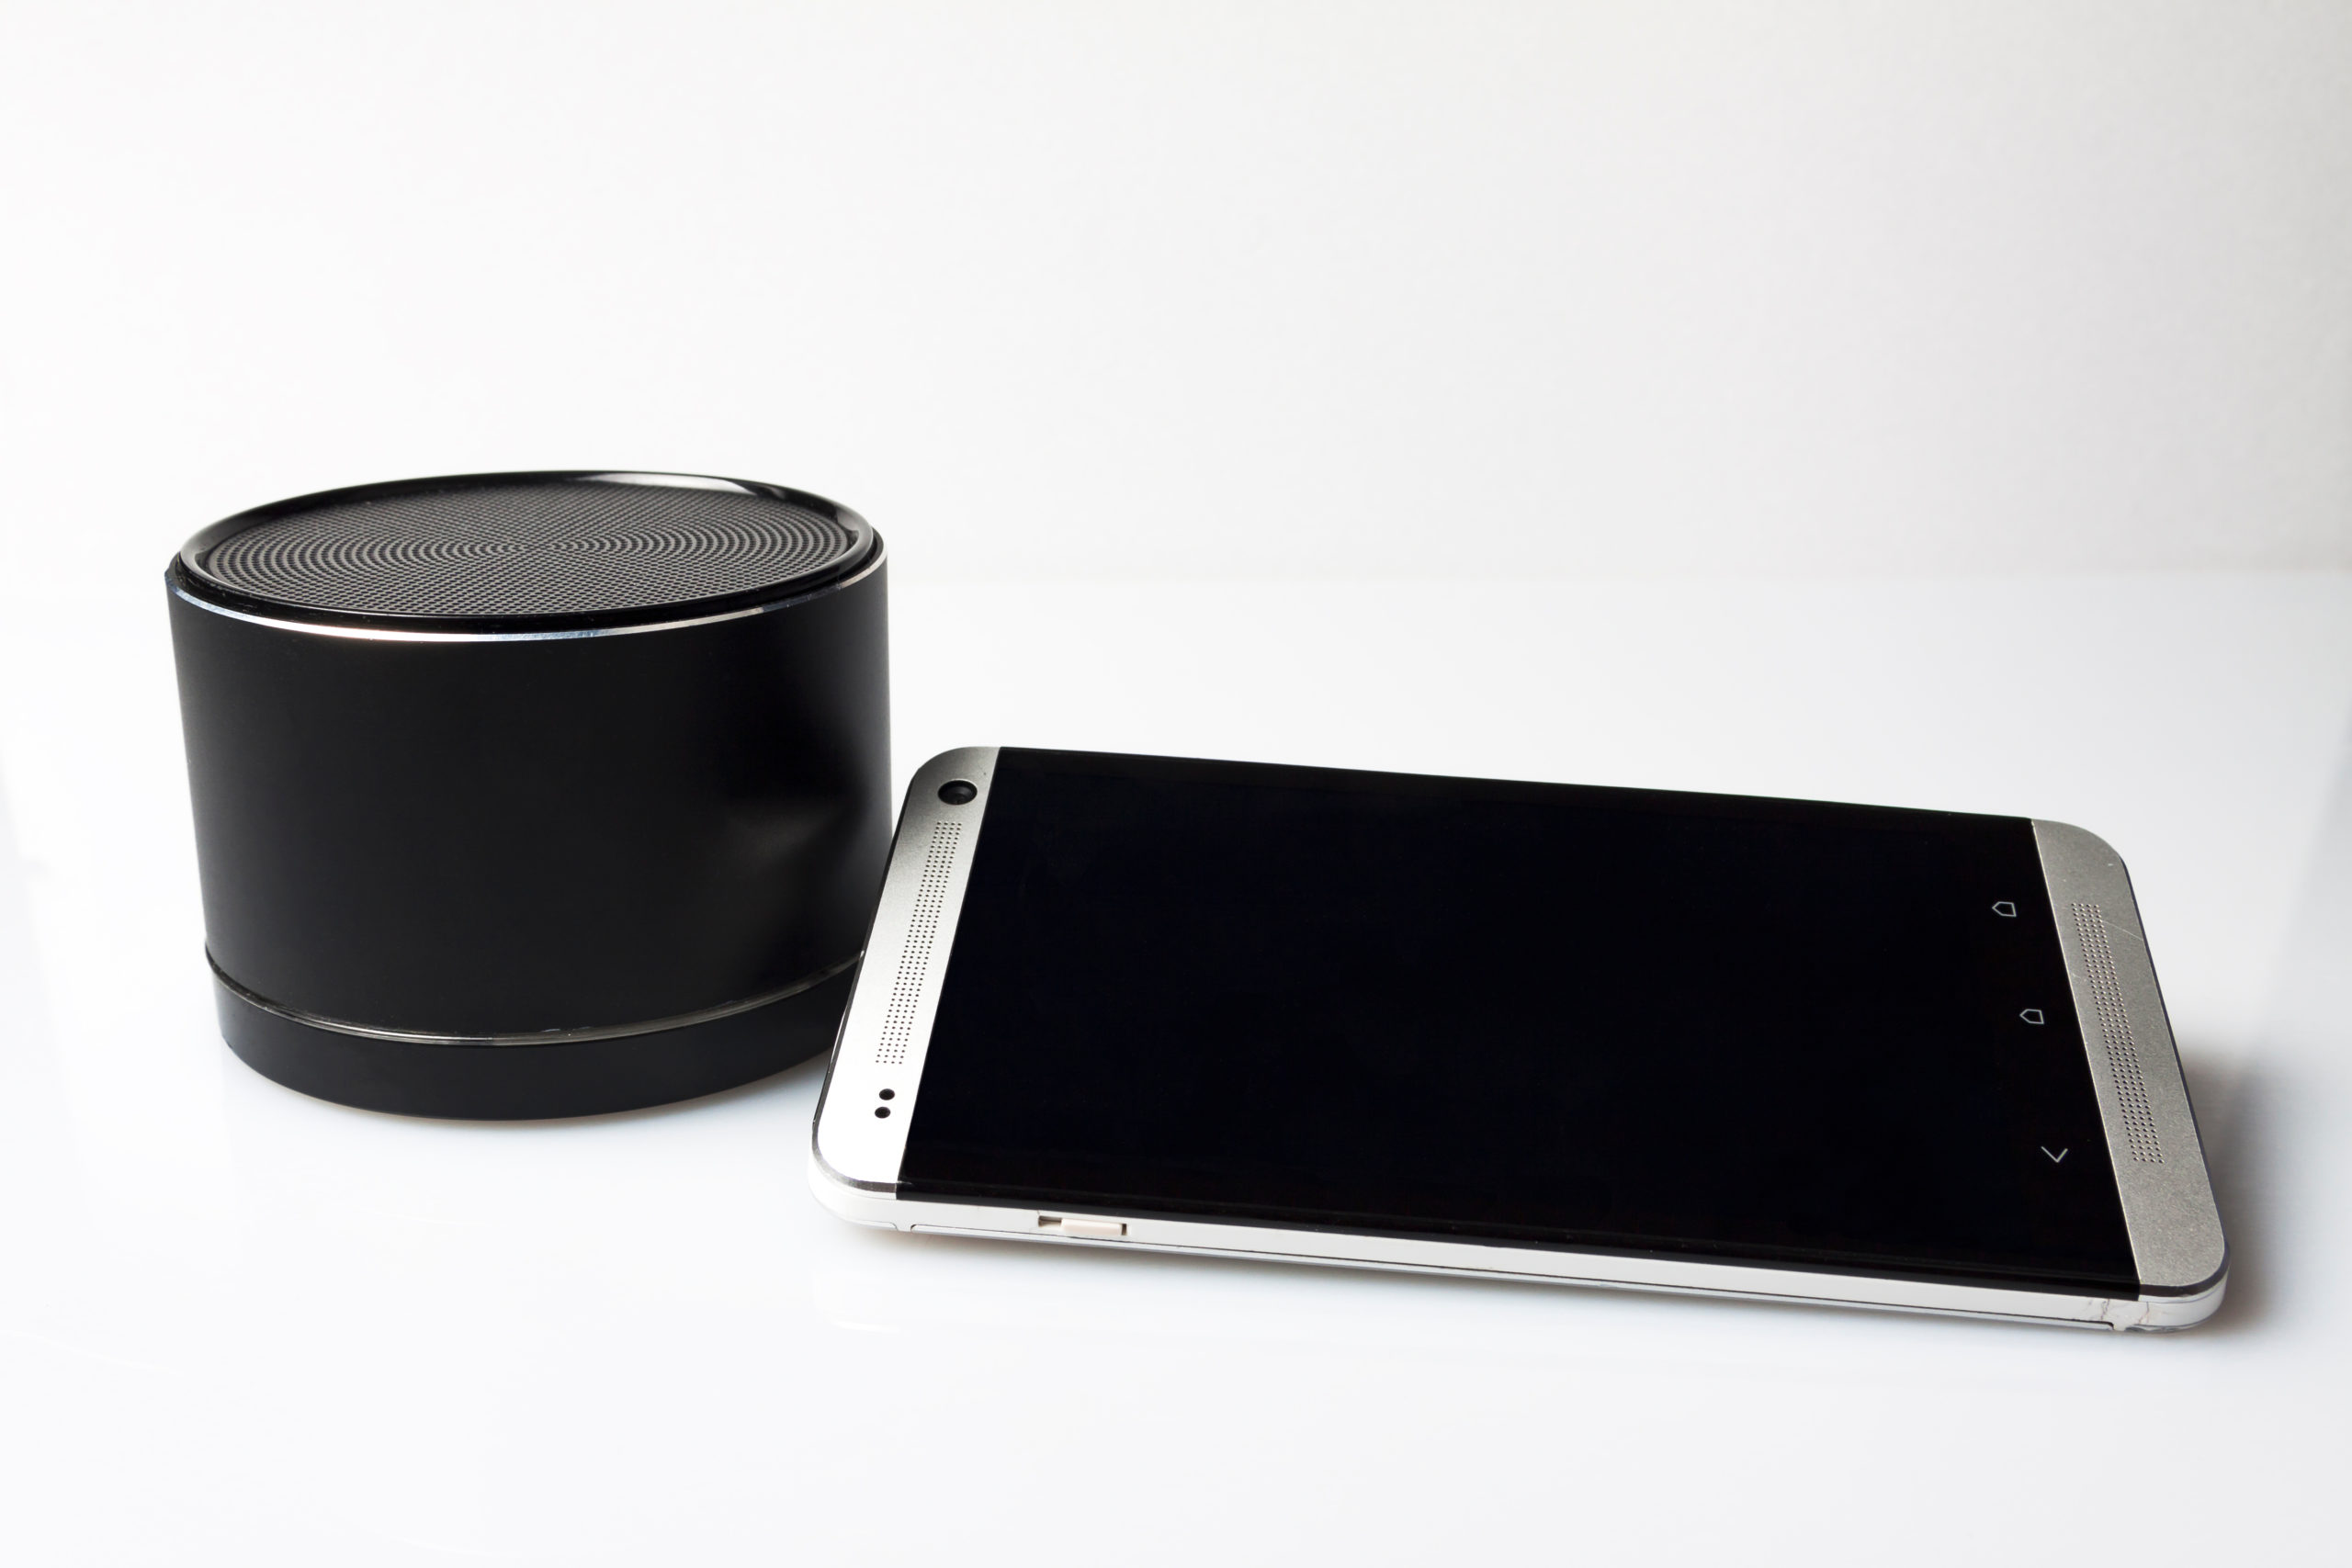
Exhibit A is the oft-discussed dilemma about the best use of on-air marketing avails, or even produced audio and video promos that offer up different ways to listen to the station – beyond using a regular radio. I’m often asked what’s the best use of promotional “real estate” – pointing the audience to a station app or a smart speaker? Of course, there is no one-size-fits-all solution (spoken like a true researcher, right?) but all things being equal, those Media Usage Pyramids you’ve probably seen us present for years hold the answer for most stations.
Yes, they can be a daunting collection of data. But if you look at them closely, the answers come into focus. Sometimes, it’s just a matter of looking at the pyramid’s key usage hierarchy. And that what I did when trying to come up with the best marketing path: smartphones or smart speakers:

To make it easier, I circled those who own a smart speaker, and it’s nearly three in ten (29%) Public Radio listeners. And then I did the same for smartphone owners- more than nine in ten of our more than 27,000 respondents.
So, easy-peasy – there are more than three times the raw numbers of Public Radio listeners walking around with iPhones and Android handsets than there are owners of Alexa, Google Home, and other devices.
 Some of you are already thinking I’m oversimplifying the question. After all, wouldn’t the results vary depending on what type of Public Radio fans we’re talking about – those who prefer NPR News stations versus those who love listening to their local Triple A noncommercial station?
And what about those who own smartphones, but who don’t really download apps? Or smart speaker owners who tend to use the timer or shopping list functions, but never ask Alexa to call up a radio station?
There’s nuance to every research question you can think of. And in Public Radio circles, I’ve met just a few smart people who just might have a tendency to overthink things now and again. (Insert smiley face here.)
I’ve uncovered a number of these “data cut” revelations, and I’m pushing my staff – and myself – to work harder to bring these insights to the surface. The more we can utilize research to prioritize our time and money – and even settle scores now and again – we’re further along toward making smarter decisions on behalf of our radio stations.
If you have an interest in Public Radio – or it’s where you work – I hope you’ll join me on Wednesday, September 21st at 2pm ET. I’ll break down PRTS 2022, and hopefully, use my statistical scalpel to uncover key findings that can help you better serve your listeners, your sponsors, and the communities you serve.
After all, isn’t that the goal?
Register for our webinar here.
I’ll have more of these data insights, and try to put it all into perspective for you.
And I just might bring a pair of scissors – or maybe a scalpel.
- In Radio, You Just Never Know - April 17, 2025
- The Secret To Making A Great Podcast (And Great Radio) - April 16, 2025
- I Read The (Local) News Today, Oh Boy! - April 15, 2025


Fred, a couple of humble suggestions for more granulated data slicing to enhance future key-usage pyramids:
(1) For podcasts, streaming audio, and streaming video, qualify the response data by asking also, “Is your use of this medium instead of tuning to a traditional broadcast? Or are you accessing content not available via broadcast?” (You could even ask them to estimate percentages for these two discrete uses.)
(2) For smartphones, ask also, “Does your phone service include unlimited data, or do you meter your data usage?” Those who don’t pay the surcharge for unlimited data seem less likely to use their smartphones as an alternative to traditional broadcasts, regardless whether the content they’re seeking is available via broadcast.
I think broadcasters, both television and radio, would very much like to know these nuances.
Good suggestions, as always, John. TS 2023 will be coming up before we know it. 🙂 🙁
As Bob Dylan stated “you don’t need a weatherman to tell you which way the wind blows”. I am a big believer in merging science /data with emotion and creativity. However Radio is so late to the party, if things don’t change,!the medium will lose all of its relevancy in the near future. The command and control structure of the corporate radio
Groups have adopted such a safe and cautious template that most radio stations are more predictable than the menu at In N Out. The difference is In N Out is a premium experience,’only available in certain regions of the West, and sought out by core fans and newcomers. What are the key attractions of music stations today? Have we researched ourselves right out of relevancy?
Well said, Kevin. Yesterday’s post – “Still The Same” – featured the same topic. Still The Same