As we present our format “deep dive” webinars for Techsurvey9, and prepare for our free Conclave webinar on June 5, I continue to marvel at the “trackability” of this massive study.
Of course, having more than 78,000 responses contributes to TS9’s stability, but I often hear questions that go to the heart of this survey’s source – email databases. Similarly in our Public Radio Tech Surveys (our fifth annual will be presented next month to stakeholders), I field queries about the trustworthiness of a “member-based” survey.
First and foremost, every survey has its limitations. These days, telephone surveys have all sorts of issues, from disappearing landlines to decreasing tolerance among consumers to complete a long questionnaire. Other studies use different sampling techniques, and each has its own set of drawbacks and fine print that you should read whenever your quote numbers or read charts and graphs.
And so it is with Techsurvey9 and PRTS5. Our focus on respondents who are a part of email (or membership) databases has its own set of biases and limitations.
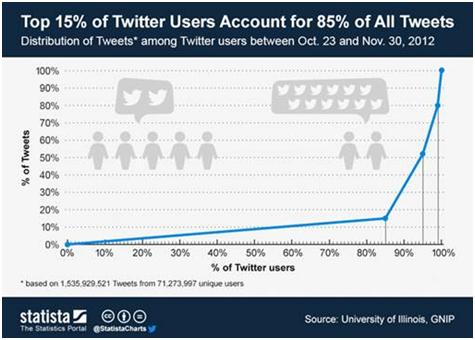
But our sample also speaks to the value of Pareto’s Principle, better known as “The 80:20 Rule.” It states that 20% of pretty much any group generate about 80% of the results. This discovery came about 0ver a century ago when Vilfredo Pareto noticed that 80% of the land in Italy was owned by 20% of its population. Smart observation.
You can affirm his principle for yourself when you think about sales reps and your total sales, as well as most other relationships in business, media, the digital space, and yes, even in life.
Consider this recent factoid about Twitter (courtesy of Steve Goldstein) which reaffirms the overriding truth of “The 80:20 Rule” or Pareto’s Principle:
So how does all this impact radio and the ratings it relies upon to generate revenue? In a world where measurement is dependent on those who consent to fill out a diary or carry a meter, an affinity to radio is a real plus. That 20% of the audience that generate the lion’s share of radio listening plays a bigger-than-life role in a radio station’s success. This hit home for me earlier this month while attending Joel Denver and Sat Bisla’s Worldwide Radio Conference in L.A. NuVooDoo’s Carolyn Gilbert was on a panel, talking about how her research clearly showed that “People who love radio carry meters.”
 And while I intuitively knew this from the work we’ve done with Arbitron, moderating hundreds of focus and L.A.B. groups, and from studying ratings patterns and usage, it was impactful for me to hear this from someone who has been studying audience behavior in relationship to the ratings for decades.
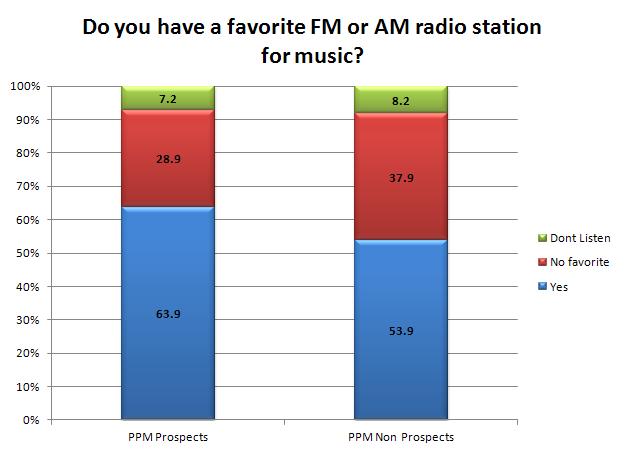
Carolyn was willing to share some of NuVooDoo’s data, and here are a couple of compelling charts that speak to how different segments of the population can play a major role in determining ratings success. In this case, we’re talking about the universe of people that enjoys radio – the same kind of people who find their way into station databases. First, PPM prospects place a higher value on all media, but especially radio, than those who are not likely to carry a meter:
And by a considerable margin, those more likely to be meter-receptive indicate they have a favorite station for music or talk . Yes, these are the kinds of people who like you enough to sign up for your database or register to listen to your stream. Here’s the music chart where you can see the obvious difference between PPM types and those who are not receptive to the ratings process.
There’s a lot to be said for understanding how those who truly enjoy and use radio think about all things tech – as well as the broadcast media they consume. This is why our Techsurveys have brought value to hundreds of stations in both commercial and public broadcasting. In just a few weeks, we’ll be presenting Public Radio Techsurvey 5 to more than 50 public radio stakeholder stations, all of whom are eager to better get to know their members and partisans – the folks who send in checks and who are more apt to carry a meter or diary.
We appreciate all the great comments we’ve heard thus far about TS9, and we remind you that next year’s Techsurvey10 will be once again open to any and all radio stations. These are the only studies that provide a national view as well as your station’s audience profile to help map out your brand’s digital footprint.
There’s a lot to be learned from that 20%, thanks to the revelation of Vilfredo Pareto and his keen observations more than 100 years ago.
Thanks again to Carolyn Gilbert and NuVooDoo for the data.
- A 2020 Lesson?It Could All Be Gone In A Flash - April 24, 2025
- How AI Can Give Radio Personalities More…PERSONALITY - April 23, 2025
- Can Radio Afford To Miss The Short Videos Boat? - April 22, 2025


Yes, the 80/20 rule applies to radio too, but am I the only one who thinks that this study reflects badly on radio?
Most of what radio used to call the “actives” are glued to their smartphones and the Facebook/Twitter/Pintrest/Snapchat/Foursquare apps on them. “The medium for people who are least likely to carry a smartphone or care about social media…” isn’t a sales pitch that’s likely to impress media savvy buyers or get radio added to the mix or increase its perceived value. There certainly is a place in the marketing world for people who are the slowest to accept new technology and hold on to old preferences, but does radio really want to own that position?
These numbers suggest that radio’s most committed users are hopelessly out of touch and behind the times. But they suggest something else too – also not good.
They imply that PPM carriers are more likely than average to be big fans of radio, which means that PPM generated PUR stats may be inflated.
The NuVooDoo research doesn’t reflect well on radio IMO. There is certainly time to fix the problem, but it must be acknowledged and confronted for that to happen.
Will 2013 feature more beta tests, or more cost cuts?
Actually, Bob, I read NuVooDoo’s top chart that likely PPM cooperators are more likely to do everything more than those who are less apt to carry a meter – from valuing radio, smartphones, social media, and even newspapers. They’re just more media engaged. As for the PURs, most broadcasters would probably like to see even higher levels, but that’s for another post and another day.
Thanks for taking the time to comment and keep the conversation going.