
Among the many disruptions that defined 2020 was the issue of “distribution” of radio station content. That is, on which devices are consumers listening to your radio station?
If I had a buck for every time someone uttered the phrase, “Content is king,” I’d have my own Caribbean island. Clichés become clichés when they prove to be true. And there’s never been a question about the importance and quality of radio programming.
But distribution – how, when, and where they hear it – has become as big of an issue. That’s been especially the case since the onset of the pandemic. As millions of Americans stopped or decreased their driving time and finding themselves at home, the distribution question rose in importance. Techsurvey data tell us that even among core radio fans, one in five don’t have a working radio at home that they use.
While 2020 will be remembered for many things, here in Radio Land, we may come to think of it as the year when streaming listening reached that “next level.” While broadcast radio listening was challenged for most of the year, many stations around the country experienced record-breaking streaming levels.
But to what extent did streaming actually impact ratings? That’s a complicated question, dependent on many factors, including whether a station elects TLR (total line reporting), as well as its accessibility via streaming on mobile apps, smart speakers, and other devices.
My experience with the latter question is there’s a sea of difference between the streaming experiences offered by broadcast radio stations (and their parent companies). Some have made serious investments in technical infrastructure and marketing. Others have taken many different approaches to their mobile app programs. And sadly, some have just mailed it in, providing the bare minimum to listeners and advertisers.
The result is the degree to which stations enjoyed streaming boosts during COVID depends on a host of different variables. Nielsen attempted to level the playing field a bit when they instituted their “headphone boost” last October. Still, most radio stations don’t exactly know the degree to which their over-the-air listening has made its way to the stream.
In that regard, radio is not alone. Television has struggled with many of these same questions as viewership shifts from broadcast to streaming. The industry has long been in need of seeing the entire landscape – local and network TV, as well as streaming platforms, like Netflix, Amazon Prime Video, Hulu, and a growing number of new challengers.
COVID has accentuated the viewership schism as Americans (and people all over the world) found themselves at home, on the couch, remote in hand.
In “TV Land,” Nielsen has responded to the data void with a new measurement tool called The Gauge. As the New York Times reported in a recent story by John Koblin, “Nielsen Now Knows When You Are Streaming,” the ratings company is finally providing the perspective television execs need to see, whether they are from the broadcast, cable, or the streaming communities.
That’s because in spite of the technology, big questions about viewership were not being answered:
- How big is streaming?
- Is broadcast TV viewing still dominant?
- Which streaming service is actually being watched the most?
Part of the blockage had to do with politics – of course. Netflix, in particular, cast doubt on Nielsen’s ability to measure streaming viewership back in 2017.
Today, they’re on board with Nielsen’s new technology – even though Netflix’s CEO, Reed Hastings, was surprised how much traditional television viewing still takes place.
Here’s The Gauge – and you’ll see immediately why Hastings and other streaming execs were taken aback by the numbers:
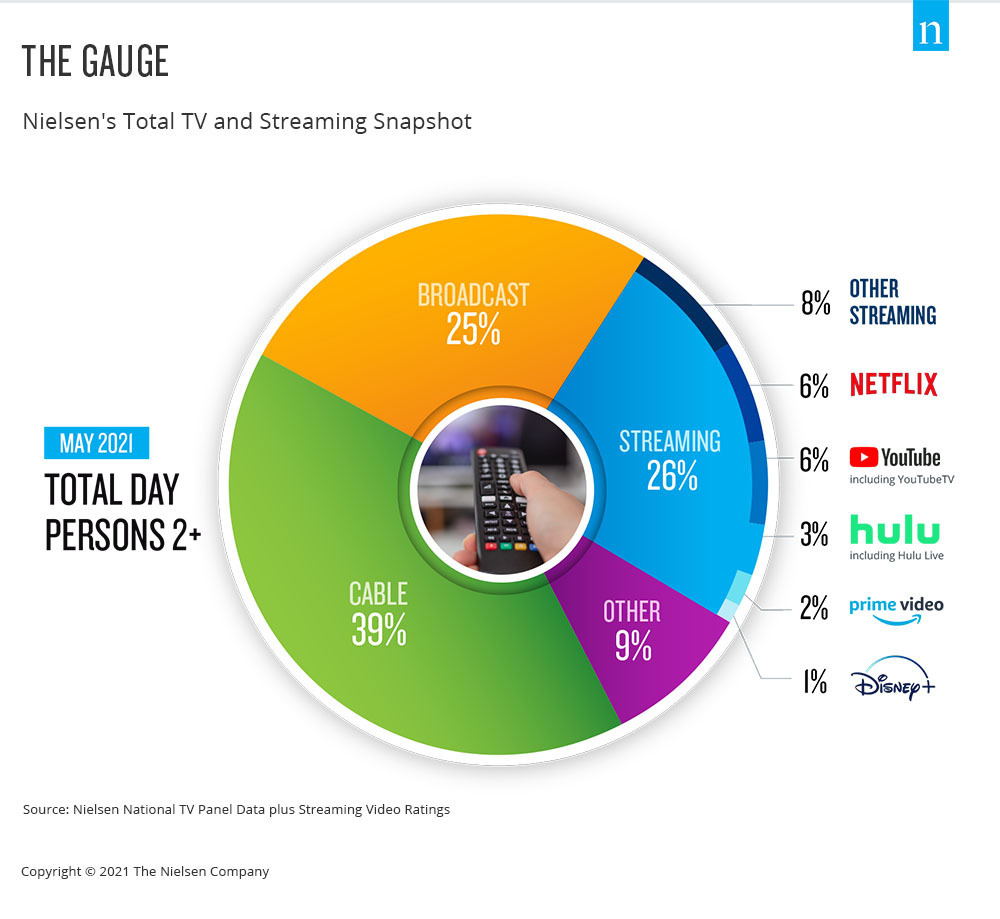
When you combine broadcast and cable viewing – “old school TV” – you’re looking at an impressive 64% of daily viewing. Streaming, on the other hand, has a 26% share of TV consumption.
 So, why is Reed Hastings now OK with Nielsen data from The Gauge?
First and foremost, of the streaming providers, he’s ahead (albeit with 6%) of Hulu, Amazon Prime Video, and lesser players.
And he also is well aware of the trajectory of these trends. In 2019, Nielsen pegged the overall streaming share at just 14%. One year later, and it’s up significantly. And most think it will continue to grow.
As Hastings explained, “It’s kind of obvious there’s a time frame over which streaming takes over linear (TV). At 6% per year, it’s not going to be long.”
By embracing Nielsen now, Hastings reasons his support will pay off on that day when Netflix (and other streaming platforms) surpasses broadcast plus cable.
How does this ratings system work? I won’t bore you with the granular details, but a few key points:
- Beyond capturing video consumption, the Gauge uses “audio recognition software”
- 38,000 households across the U.S. participate in these ratings
- The system only measures what is seen on television screens – not on mobile devices or computers
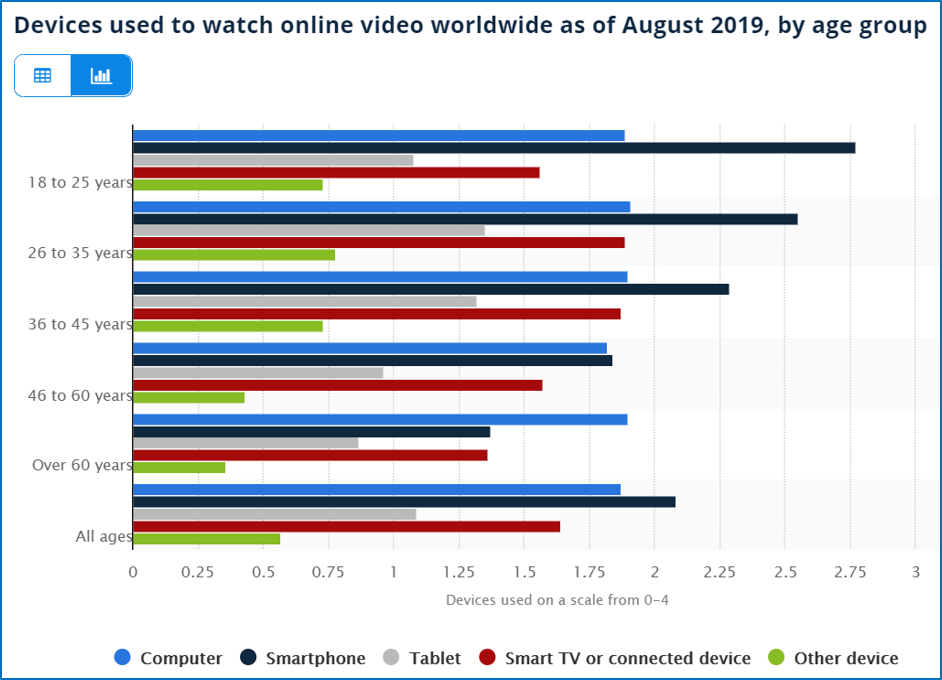
That last bullet point is an important one, especially as it concerns younger people and their viewing patterns. According to Statista, the data clearly shows they are far more likely to watch just about anything on their smartphones (the black bars below):
There’s also that mention about the “audio recognition software.” The radio guy in me hears that term, and immediately thinks PPM technology.
And that bring us to the key question that might come to mind after reading about The Gauge:
Why don’t we have a ratings system in radio that combines streaming, satellite, and broadcast radio – and not just “radio vs. radio?”
Even with the inherent limitations of The Gauge, the fact it lays out the entire spectrum of viewing gives TV execs an expanded view of the entire field.
So, what about audio?
As more and more broadcasters have made investments in streaming, mobile apps, smart speakers, and podcasts, shouldn’t they have the same tools at their disposal as the video side of the spectrum?
The Gauge may have limitations, but an audio version would sort out the constant questions broadcasters, streamers, the satellite folks, and podcasters hear and think about every day.
When I saw The Gauge graphic (above), I got that strange feeling I had seen something like it before.
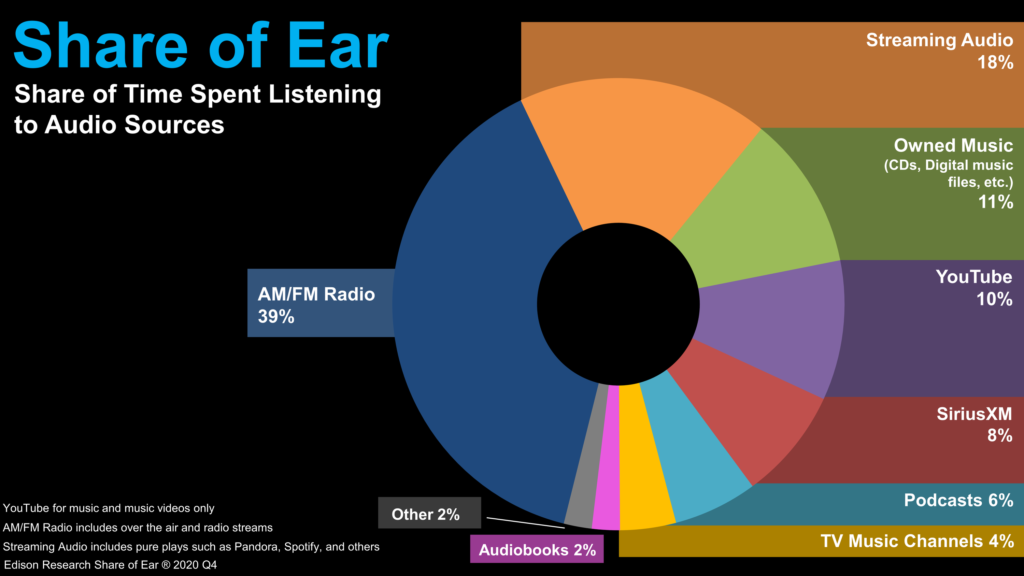
Chances are, you’ve see it, too. It’s Edison’s Share of Ear data, a look at the entire audio spectrum.
As the chart shows, the share of AM/FM radio listening leads the audio pack with 39%. That compares favorably to the share of broadcast TV viewing on The Gauge. According to Nielsen’s data, it’s just 25%.
Share of Ear data, however, is collected much differently. Respondents record all their audio listening in a diary over a 24-hour period to produce the chart you see above.
So, when will Nielsen Audio publish the audio version of the ratings, combining all the different categories as Edison does in their survey? I checked in with the Nielsen team to find out.
They tell me the company indeed plans to measure both broadcast and digital audio (including streaming and podcasting) as part of their Nielsen ONE initiative. That platform uses common metrics, an integrated panel, and big data sources.
As a spokesperson explained:
“Nielsen ONE for Audio will report the total unduplicated audience across broadcast and digital platforms for Audio content, as well as the audience for the component parts. Using big data together with panel data enables reporting of audio sources of all sizes and enhances the stability of the estimates.
“Panel data is needed to provide complete coverage, duplication, and demographics. In this context, measurement will be more of a team sport since content providers need to provide access to their big data so we can integrate it with the panel data.”
But what about getting all the players on the same page, a challenge similar to what Nielsen has faced on the TV side? Has the company learned from the Netflix negotiations and related speed bumps it has experienced?
Here’s what they told me:
“We are in active discussions with the major broadcast and digital players regarding Nielsen ONE and bringing big data into the fold. The need for accountability is paramount for advertisers, and we believe traditional and digital audio players have incentive to cooperate for credible and independent measurement. Our progress with Netflix and other digital players in video gives us confidence about our work in the digital audio world.”
As is always the case when you’re dealing with 800 pound gorillas with lots of chips on the table, the devil is indeed in the details. Can Nielsen thread the needle and appease all parties to get Nielsen ONE off the ground? When might that happen? What will it cost?
The implications of this expanded measurement for audio are obvious. As we learned with Arbitron ratings years ago, commercial broadcasters didn’t take public radio seriously until all those NPR stations actually started showing up in “the book” when PPM came along. Until then, public radio numbers simply weren’t printed. If you can’t see your competitors’ numbers, they don’t exist.
That’s analogous to the situation today. When you don’t see Spotify or SiriusXM’s share, you stay focused on beating B107 and the Eagle – the competitors that appear in the ratings every week, every month, and every quarter, depending on where you live. It’s the “other radio stations” that determine your rate, your bonus, your overall position, and your future.
When the natural order of the hierarchy changes, so might the equilibrium of the industry. Consumers are using these services to entertain and inform themselves. Radio broadcasters need to see precisely what they’re up against.
Pain and discomfort are often the byproducts of data, as in TV, learning where, in fact, you stand. Seeing The Gauge for the first time is literally an eye-opener. But it’s also a reality check for all players.
Reed Hastings was surprised Netflix was positioned so low. And now, the competitive games begin. You know that once he first laid eyes on The Gauge, he immediately convened his team and began to plot out “what’s next?”
 What will they do to drive up Netflix’s share? What can TV broadcasters and the cable companies do to fight back, and perhaps provide better products or services for less money?
Let the games begin.
Radio needs a better gauge.
- How AI Can Give Radio Personalities More…PERSONALITY - April 23, 2025
- Can Radio Afford To Miss The Short Videos Boat? - April 22, 2025
- Media And Technology In 2025: Believe It Or Not! - April 18, 2025



Given what Nielsen charges broadcasters it would be nice if they could move this along with a little more urgency.
David, I think it’s complicated. But I share your frustration and impatience. We’ve done without this since the beginning of the Digital Era, and that division between broadcast and streaming is only becoming more important. Thanks for the comment.
I listen to Iheart radio stations. But they drop like every 20-30 minutes but I keep pumping them back in. Does this increase Ihearts ratings restarting frequently?
No, Eric, and it tends to anger listeners. Hopefully, they’ll figure it out.