We all see more research in a week than we used to see in a year. Everyone’s producing data, polls, charts, and graphs that are meant to explain what’s really going on in our media and technology lives.
And there’s more to come. In the coming weeks, Techsurvey11 will be rolling out with some amazing findings. The study was closed yesterday, and we achieved some spectacular numbers. Over 200 stations from around North America participated, producing more than 41,000 interviews. To say that it’s the biggest study in radio is an understatement. We have seen enough of the data to tease you that there’s some spectacular information coming your way.
Our stakeholders will see the results first in a private webinar, followed up by our presentation at the Worldwide Radio Summit in L.A. on April 22nd.
 But with all this data bombarding your inbox, your Twitter account, and convention presentations, it can be difficult to machete your way through the tall grass of the metrics, trying to determine what’s meaningful and what’s trivial.
Sometimes though, the data is so compelling and so macro that you know you’re looking at something special. So in today’s post, I have three examples of data that is screaming at us to pay attention. And all of them have implications to the core business of radio.
Exhibit A: Digital spending – AdAge is now grappling with the efficacy and effectiveness of digital advertising. And we’ll leave that quandary to them because it’s a gnarly issue that has so many variables that it’s impossible to make a meaningful determination.
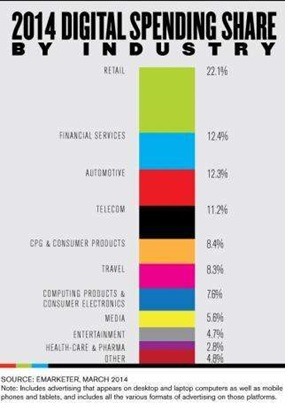
But whether digital advertising works is almost secondary to the fact that more and more companies and categories are shifting dollars to the tech sector. Inside an article called “Marketers Look To Digital For Cure-All,” AdAge included this chart from eMarketer that shows the increasing percentage of ad budgets that are now going to digital platforms.
Yes, some of radio’s key groups – from retail to automotive to consumer products – are moving their strategic focus in a decidedly more digital direction, forcing radio to continue to work hard to develop its digital assets. Big brands like P&G and Heineken are spending as much as 25% of their ad budgets in the digital areana.
An interesting side note to this analysis is the suggestion that perhaps an over-reliance on digital may be hazardous to a brand’s sales health. If there’s any truth to that, then an integrated campaign (they used to call it “media mix”) that includes broadcast makes even more sense. As even low-level marketers know, digital ads can move eyeballs for discounts, deals, and impulse purchases. But when you want to build brands and product images, it’s hard to do it without broadcast media. Perhaps that will be an offshoot of these advertising effectiveness analyses.
Exhibit B: Apple’s sheer dominance – There’s been a lot written about Apple’s sheer dominance during the past several weeks, especially after quarterly numbers that were the best ever in the history of American business.
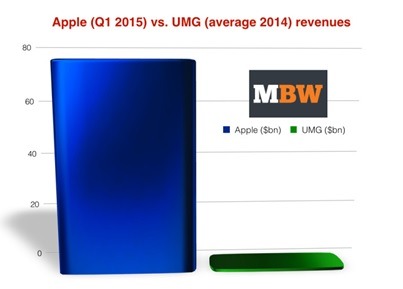
That’s a hard act to follow, but Music Business Weekly may have done it. Their amazing stat is that Apple makes more money every three weeks than the entire global recorded music industry makes in a year.
The chart shows how the biggest music company Universal Music (and Universal Music Publishing) fares up against Apple’s dominance. Yes, Apple’s revenues are 75 times higher than UMG’s
Everyone knows that Apple has become the most powerful and successful company on the planet, but when you hold them up against the entire music business, you get an even better sense for how they’re totally crushing the space.
 Exhibit C: The Grammy’s Live Tweeting – We all know that live megawatt events – like the Super Bowl or the Academy Awards Show – brings out millions of snarky tweeters from around the globe. But just how dominant is this tweeting activity around an event like The Grammys?
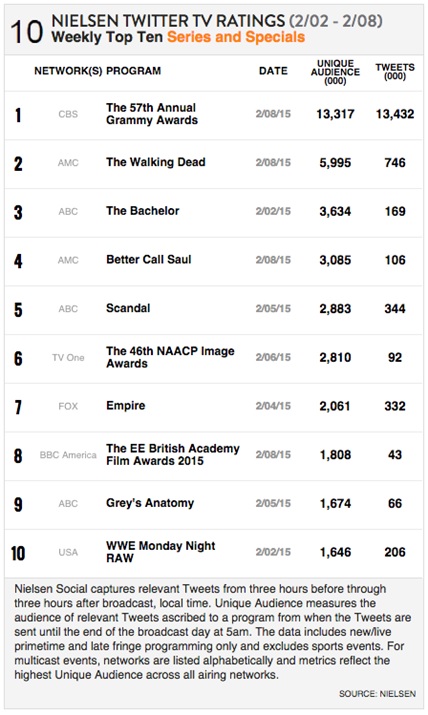
Nielsen just released its weekly Twitter engagement numbers, an increasingly important ranker for TV executives. And the Grammy numbers blow every other show away.
You’re looking at more than 13 million people using Twitters to discuss, handicap, love, and make fun of the Grammy Awards. (Too bad Nielsen doesn’t calculate a Snark Ranker.) That’s more than double the stats for The Walking Dead.
And in terms of the raw numbers, The Grammys generated better than six times more total tweets than the other nine shows combined.
This engagement with real-time television is amazing, but it also makes a statement about the power of music and its iconic stars to generate conversation, humor, and adoration. This kind of conversation may be digital in nature, but it is a lively online discussion, not all that different from DJs and listeners talking about music on the radio.
This is more affirmation about the power of music to ignite passion and emotion, and radio’s continued opportunity to remain a player in this space.
So we have three pieces of data that continue to remind us that the ways in which we evaluate success, define industry leadership, and track monetization are changing faster than ever before.
Yes, numbers lie, but here are three data points that are a window to the change that’s all around us.
And it’s breathtaking.
- What To Do If Your Radio Station Goes Through A Midlife Crisis - April 25, 2025
- A 2020 Lesson?It Could All Be Gone In A Flash - April 24, 2025
- How AI Can Give Radio Personalities More…PERSONALITY - April 23, 2025


Leave a Reply